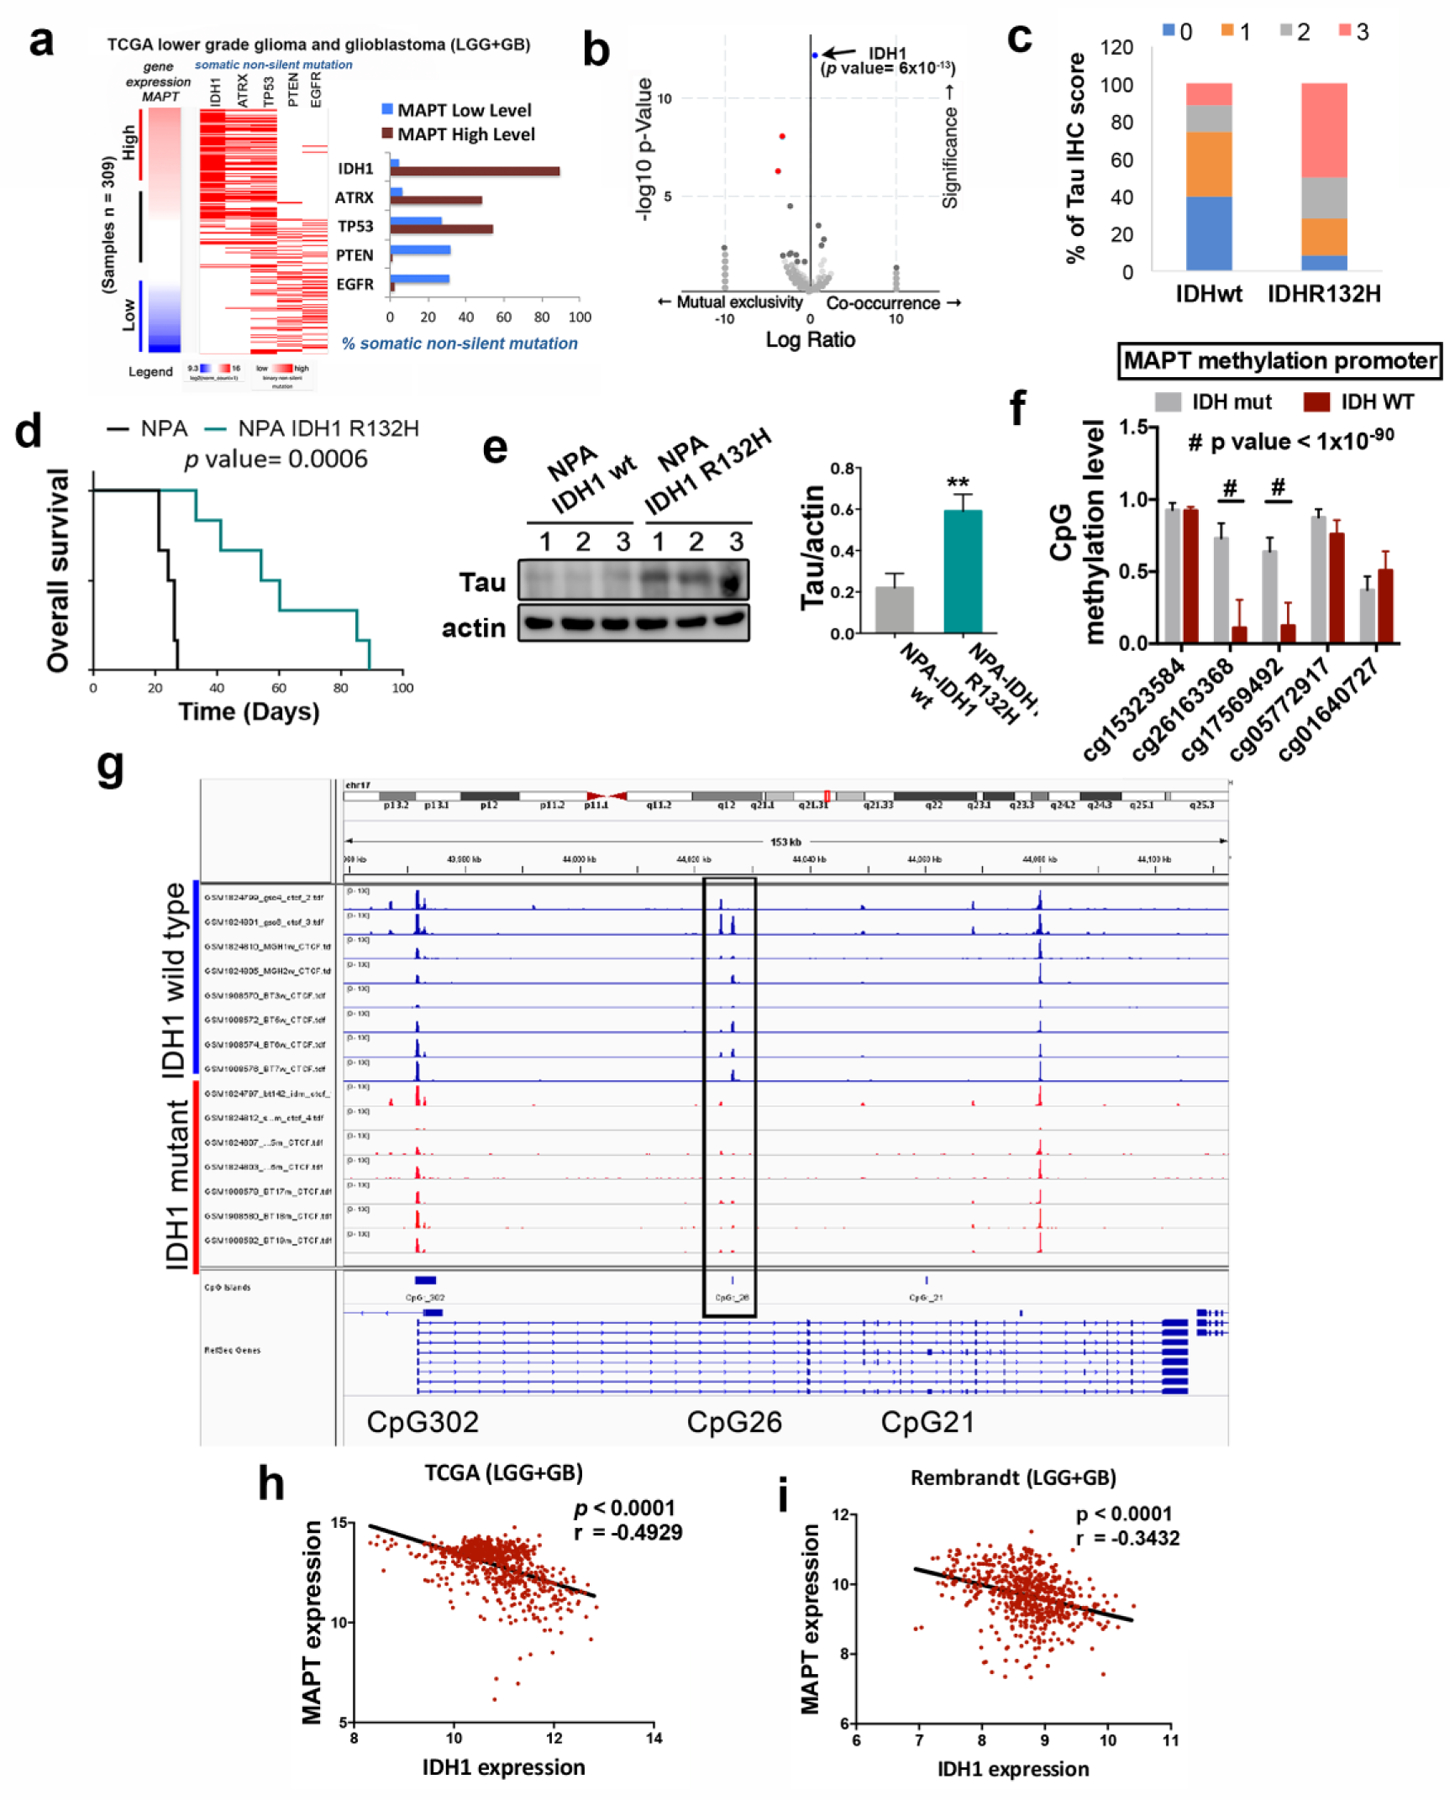
Figure 3: Tau expression is regulated by IDH1/2 function.

a, Analysis of non-silent somatic mutations in genes commonly modified in diffuse glioma grouped based on high or low expression of Tau (MAPT). b, Volcano plots showing mutated genes with differential distribution in glioma comparing tumors with high and low level of Tau. The arrow points to IDH1 mutations. c, Percentage of tumors with different Tau IHC score in wt (n= 35) and mutant (n=36) IDH1 gliomas. d, Kaplan-Meier overall survival curves of mice that were orthotopically injected with NPA IDH1 wt or NPA-IDH1 R32H cells (n=6). e, WB analysis and quantification of Tau expression in intracranial tumors from (d). Actin was used as loading control. f, Quantification of the methylation of CpG26 using 5 different probes and comparing IDHwt vs IDHmut gliomas. g, CTCF-binding profiles for the Tau (MAPT) CpG26 locus in IDH-mutant and IDH wild-type tumors, normalized by average signal. h,i, Correlation of the expression of Tau (MAPT) with that of wild-type IDH1 using the TCGA-merge (LGG+GB) (n=) (h) and the Rembrandt (LGG+GB) (n=580) (i) cohorts . **, P ≤0.01; ****, P ≤0.0001; #, P ≤1×10−90
