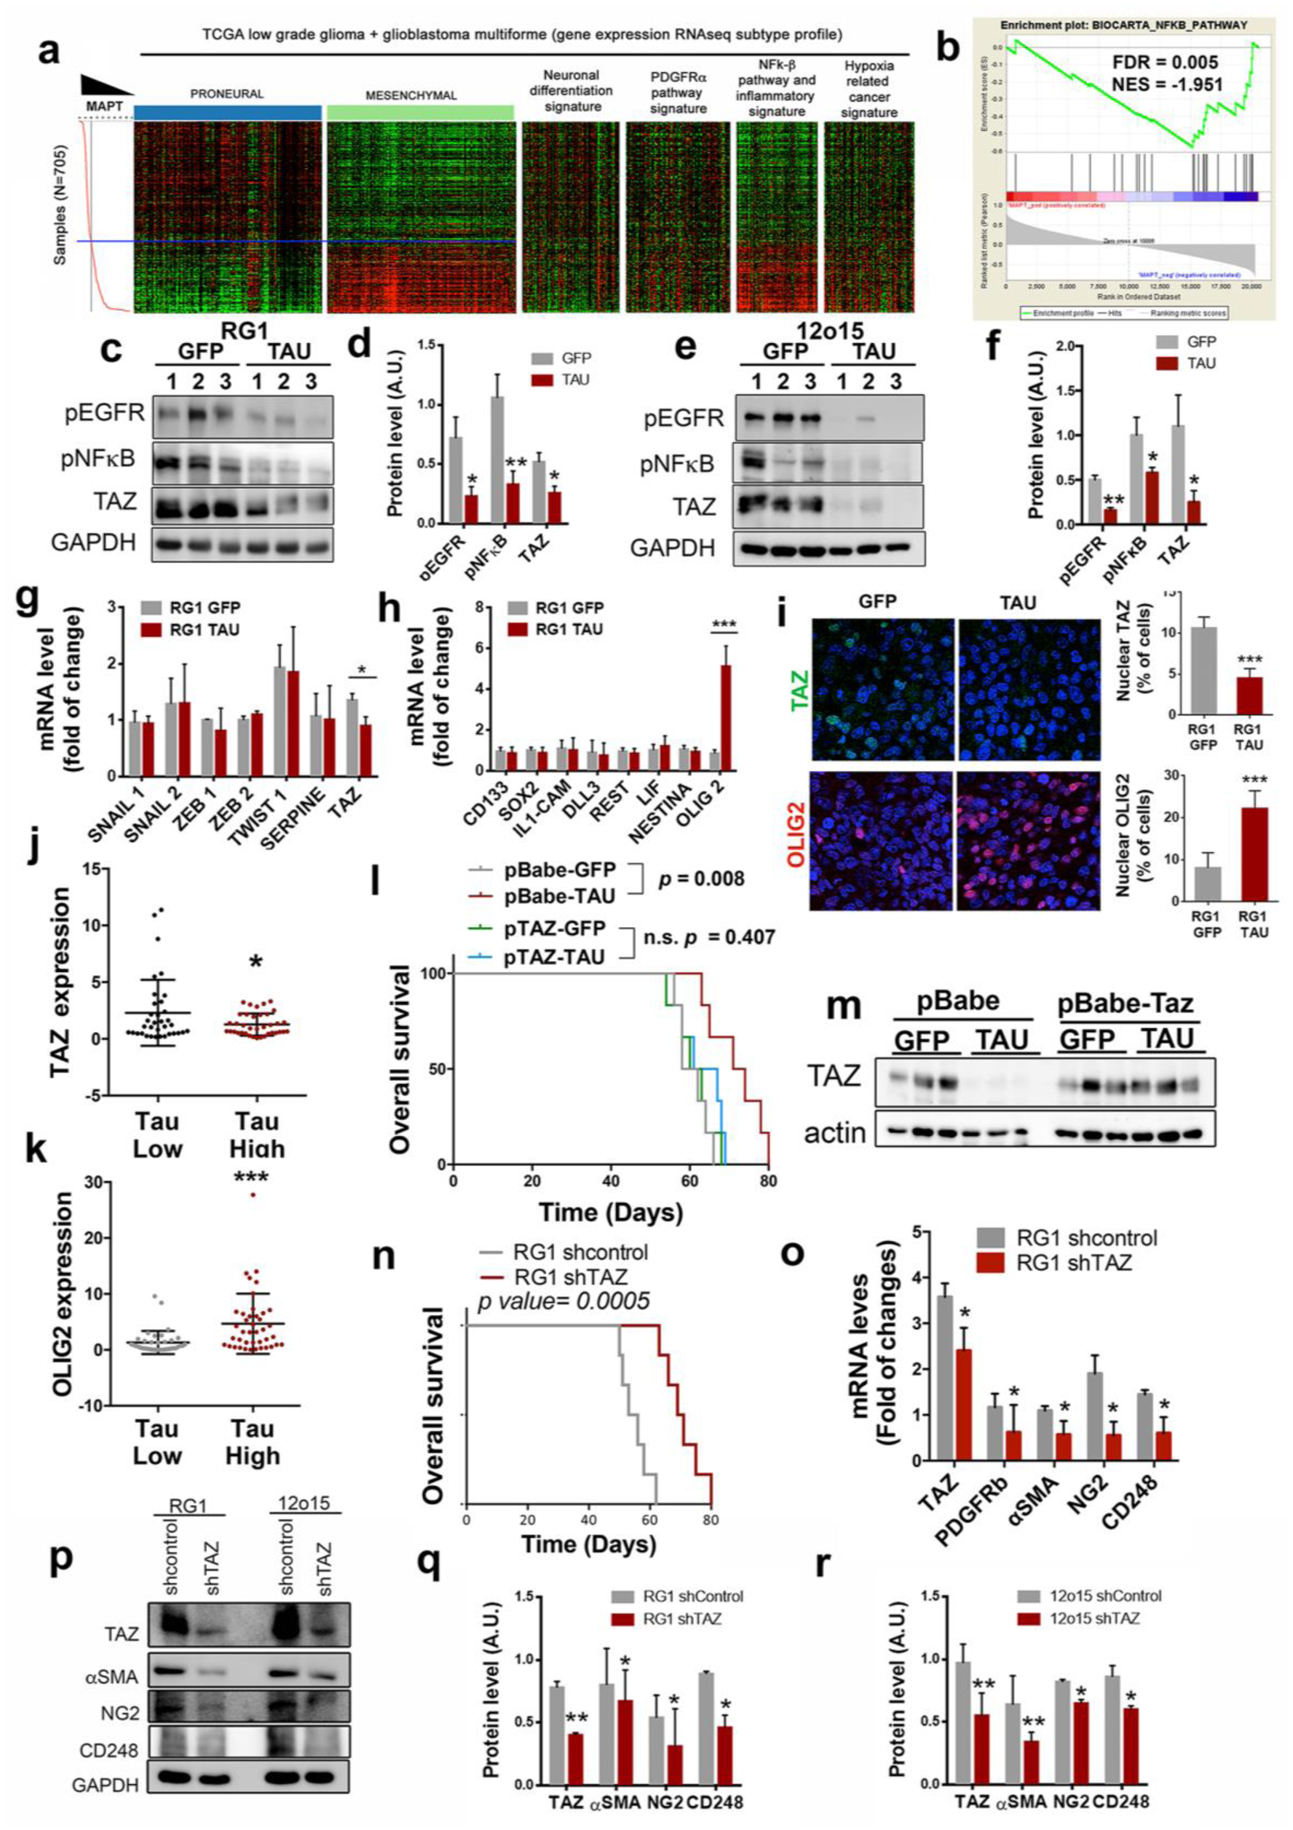
Figure 6: Tau blocks the mesenchymal features of EGFRamp/wt cells through the inhibition of the EGFR/NF-κB/TAZ axis.

a, Heatmap of PN, MES, neuronal differentiation, PDGFRα pathway, NF-κB/inflammation, and hypoxia-related cancer expression genes depending on Tau (MAPT) expression levels. b, GSEA enrichment plot analysis using Tau gene expression values as template and the NF-κB pathway geneset from the Biocarta pathways database. c–f, WB analysis (c,e) and quantification (d,f) of phosphorylated EGFR (pEGFR), phosphorylated pNF-κB (p65) and TAZ in RG1 (c,d) and 12o15 (e,f) xenografts expressing either GFP or Tau. GADPH was used as a loading control. g,h, qRT-PCR analysis of MES (g) and PN-subtype (h) related genes in RG1 xenografts expressing GFP or Tau. HPRT was used for normalization. i, Representative images of TAZ (top) or OLIG2 (bottom) IF staining of sections from GFP or Tau overexpressing RG1 gliomas. Quantification is shown on the right. j,k, qRT-PCR analysis of TAZ (j) and OLIG2 (k) in gliomas. Tumors were classified in two groups based on the expression of Tau (MAPT). (n=72). HPRT expression was used for normalization. l, Kaplan-Meier overall survival curves of mice that were orthotopically injected with RG1 cells overexpressing GFP, Tau or Tau plus TAZ (n=6). m,WB analysis of TAZ in the tumors (l). Actin was using as loading control. n, Kaplan-Meier overall survival curves of mice that were orthotopically injected with RG1 shControl or RG1 shTAZ cells (n=6). o, qRT-PCR analysis of pericytic–related genes in RG1 shControl and RG1 shTAZ xenografts. p–r, WB analysis (p) and quantification (q,r) of TAZ, αSMA, NG2 and CD248 in RG1 (p,q) or 12O15 (p,r) cells after TAZ downregulation. GADPH levels were used for normalization *, P ≤0.05; ***, P ≤0.001.
