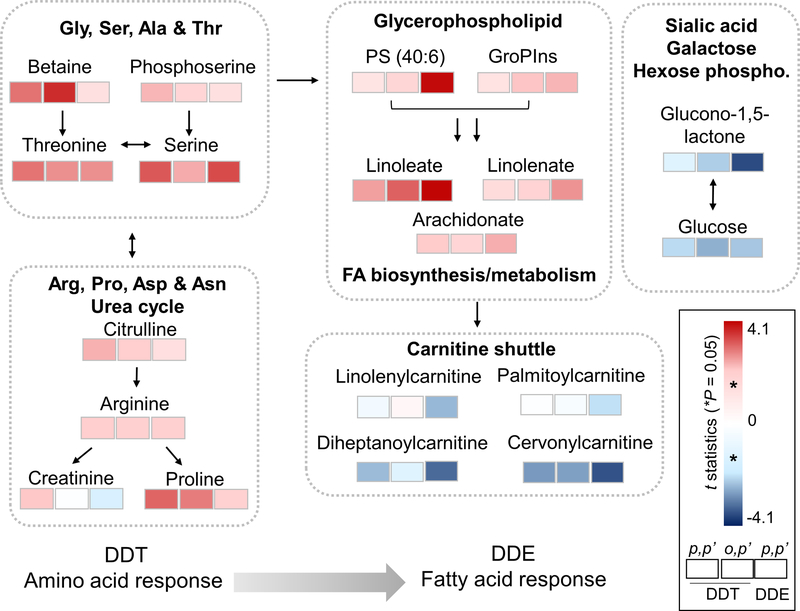
Figure 4.
Key metabolites (raw P < 0.05) in enriched metabolic pathways associated with DDT and DDE exposure. Left to right: p,p’-DDT, o,p’-DDT and p,p’-DDE. Colors are coded by significance of the association (t statistics) showing differences in metabolic responses associated with the exposure: In addition to amino acid metabolism, the metabolite p,p’-DDE was uniquely associated with metabolites involved in lipid and fatty acid metabolism. Red indicates positive association and blue indicates negative association quantitated by t statistics. The metabolites here are annotated by accurate mass (5 ppm, Supplemental Table S2), and selected metabolites were further confirmed by authentic chemical standards (Figure 5).

