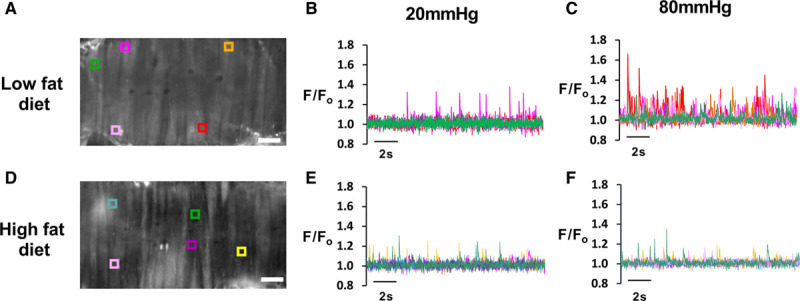
Figure 4.

Differential pressure regulation of Ca2+ spark frequency in high fat–fed and low fat–fed arteries. A, Confocal image of an intact pressurized mesenteric artery from a low-fat diet mouse with representative F/Fo traces (B and C) derived from regions of interest (ROI) as shown on the image at 20 mmHg (B) and 80 mmHg (C) of intraluminal pressure. D, Confocal image of artery from high-fat diet mice with changes in F/Fo at ROI at both 20 mmHg (E) and 80 mmHg (F) intraluminal pressure (for quantification of Ca2+ spark characteristics, see Figure S6). F/Fo indicates fluorescence intensities relative to baseline.
