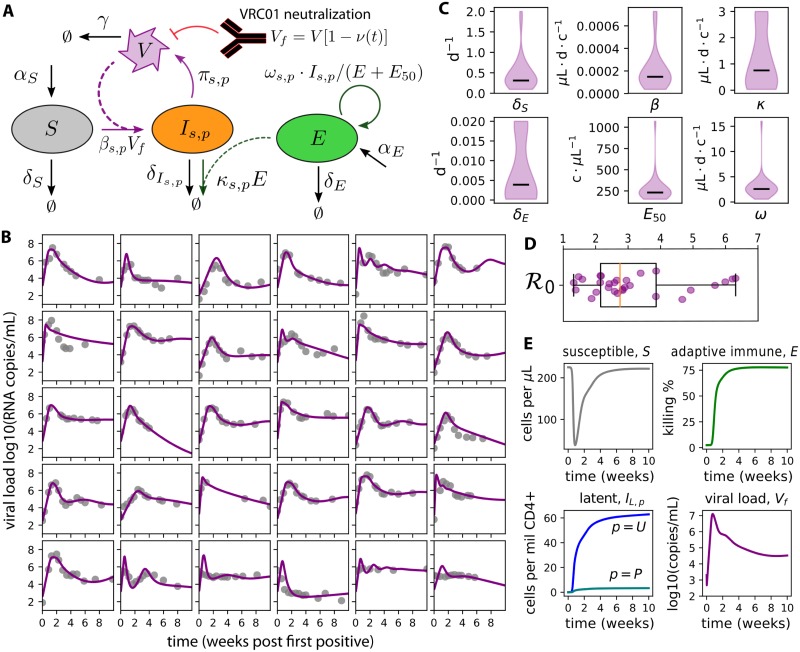
Fig 2. A mechanistic mathematical model of HIV primary infection including VRC01.
A) Model schematic: susceptible cells S become infected Is,p. If the cell is activated s = A and the provirus is productive p = P, that cell produces virus with rate π. An adaptive immune compartment E is recruited to remove infected cells with rate ω, but saturates when E > E50. The presence of VRC01 reduces free virus Vf. B) Best-fit models of natural HIV dynamics (without VRC01) using data from the RV 217 trial [23] demonstrates satisfactory fit to heterogeneous viral-load kinetics. C) Density plots of distributions of 6 estimated parameters (lines-medians, c-cells, d-days). 8 parameter values were set constant based on past studies; see Table 2 for constant values and initial guesses for estimated parameters. D) Calculated values of the basic reproductive number , the average number of new infected cells generated due to a single infected cell in a fully susceptible population. E) A representative model simulation using mean values from density plots in C recapitulates features of host-cell dynamics during HIV primary infection. Susceptible cells decrease by approximately 200 cells/μL and reconstitute by viral set-point. Latently infected cells are generated within the first week of infection and contain plausible levels of total HIV DNA (unproductively infectious latent provirus Is = L, p = U) and replication competent provirus (productively infectious latent provirus Is=L,p=P). Adaptive immune cells E become significant around the time of peak viral load (approximately 10 days after first positive) and adjust viral load set-point.

