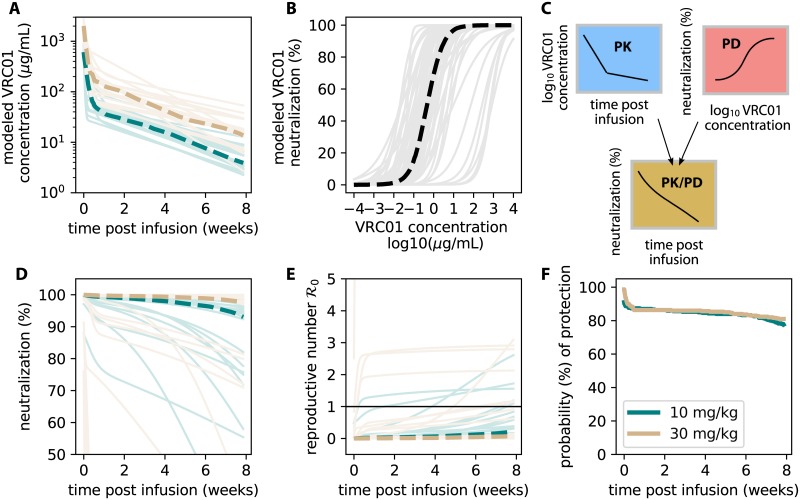
Fig 3. The serum PK and in vitro PD provide an initial estimate for AMP protection.
A) Modeled PK kinetics using estimates from S1C Fig and Eq 1. B) Modeled PD dose-response curves using data from S2A Fig and Eq 2. C) Illustration of the modeling framework: a single PK concentration kinetic curve () is combined with a single static PD neutralization (IC50, h) to model individual neutralization at some time post infusion (Eq 3). D) 1000 simulations of neutralization during an AMP dosing interval were performed to calculate average quantities (plotted as dashed lines). 25 randomly drawn examples are plotted as lighter lines. E) Modeling the reproductive number modulated by VRC01 neutralization given an exposure at some time. Each PK/PD curve is rescaled by a single reproductive number (Fig 2, Eq 4). If exposure occurs when (threshold highlighted by thin black line), protection from infection is likely. Some parameter ranges allow for breakthrough infections, typically late in the dosing interval and in the lower dose arm (10 mg/kg, teal). F) The fraction of simulations having over time demonstrates that in vitro potency measurements and serum concentrations predict excellent prevention efficacy. In all simulations thick dashed lines indicate median values and colors indicate study arm.

