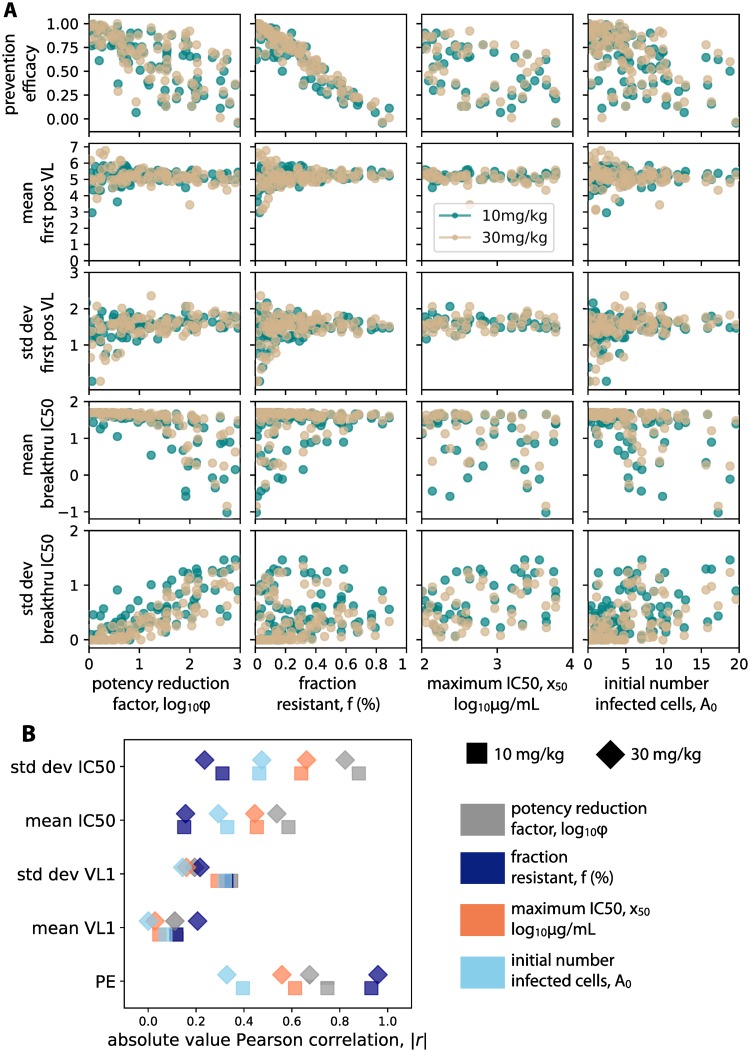
Fig 5. Global sensitivity analysis links unknown biological variables to measurable trial outcomes.
A) Results from 100 simulations of each dosing arm correlating sensitivity analysis variables (see Table 1 for definitions) against measurable trial outcomes. For each simulation, a value of each sensitivity analysis variable was chosen from a LHS sample. 100 functional exposures were simulated in each trial. Correlations agree in both dosing arms—teal 10 mg/kg, tan 30 mg/kg. B) Absolute values of Pearson correlation coefficients (marker shape indicates dosing arm) show that different variables correlate more strongly with different outcomes. Potency reduction factor and resistant fraction are the most strongly correlated overall, but each correlates more strongly with a different sensitivity analysis variable: potency reduction factor most strongly correlates with the standard deviation of breakthrough virus IC50, whereas resistant fraction correlates most strongly with prevention efficacy.

