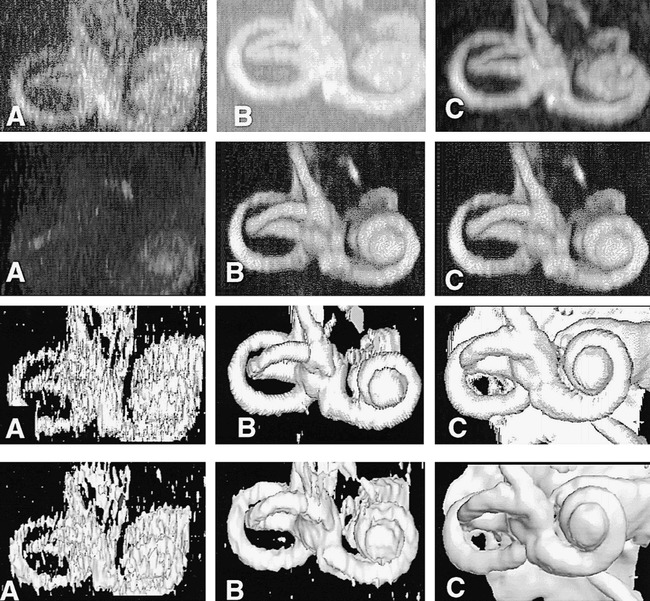
fig 4.

The effect of increasing S/N ratio on each of the four visualization techniques. Images labeled A (left column) are renderings from studies obtained with an FOV of 60 mm, images labeled B (middle column) are from studies obtained with an FOV of 100 mm, and images labeled C (right column) are from studies obtained with an FOV of 130 mm. Row 1 were rendered using method 1 (MIP), row 2 using method 2 (ray casting with transparent voxels), row 3 using method 3 (ray casting with opaque voxels), and row 4 with method 4 (isosurface rendering). The images show rapid degradation of visualization obtained with methods 1 and 4, as FOV and S/N ratio are reduced. Method 2 continues to produce excellent renderings at an FOV of 100 mm, with no apparent degradation as compared with images acquired at 130 mm
