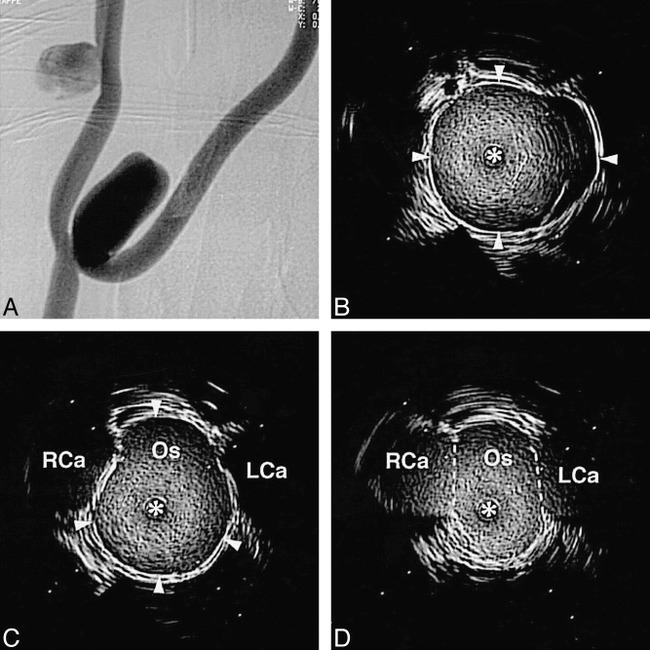
fig 7.

A, Angiogram of experimental aneurysms. The projection is optimized to allow visualization of the bifurcation aneurysm's neck.
B, Intravascular sonogram in the dome of the bifurcation aneurysm (arrowheads define the wall of the aneurysm).
C, Intravascular sonogram at a location just on the aneurysm side of the ostium (Os). The adjacent right and left carotid artery branches (RCa and LCa, respectively) are seen on either side of the aneurysm's wall as hypoechoic regions (arrowheads define the wall of the aneurysm).
D, Intravascular sonogram at the isthmus between the ostium (Os) and adjacent bifurcation branches (dashed lines indicate position at which ostium opens into the bifurcation of the left and right carotid arteries, LCa and RCa, respectively). In the intravascular sonograms the distance between white marker dots is 2 mm, and the intravascular sonographic catheter is defined by an asterisk.
