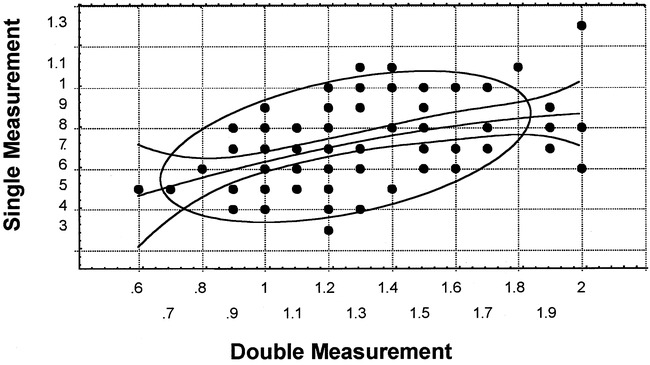
fig 4.

Scatterplot of single and double measurements, with third-degree polynomial regression and its 95% confidence limits and an ellipse of the 95% confidence limits around the common mean of both measurements. A number of readings are outside the 95% confidence limits. The scales of the measurements differ for graphic reasons. The correlation coefficient is statistically significant (r = .435, P < .001). Most outliers are located at the higher end of the measurements
