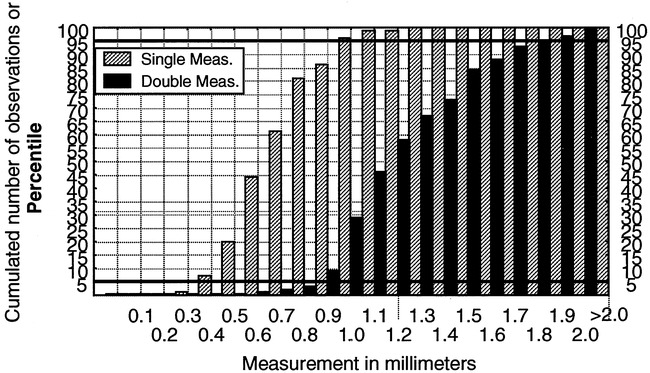
fig 5.

Histogram of the cumulated frequencies of the surface and sulci measurements on the same scale. Because the number of subjects is 100, the cumulated frequencies are equivalent to percentile distribution. For illustrative purposes, the 5th and 95th percentiles are delineated. The median is equal to the 50th percentile. Smoothing of the graph can be done by hand by joining the center of each consecutive column of cumulated frequency
