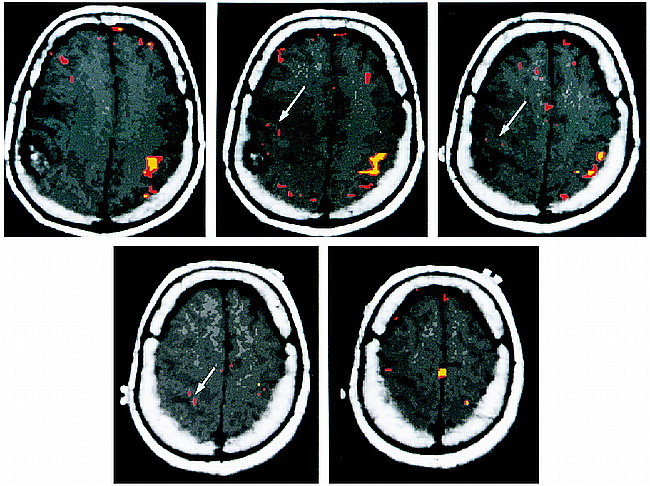
fig 1.

Axial T1-weighted images with coregistered functional MR images obtained during a bilateral motor paradigm show a larger volume of activation on the normal side than on the side with the tumor (arrows). This effect is seen for different correlation coefficients (r). The red areas indicate significant activation for r = .48, P < .01. The yellow areas indicate significant activation for r = .60, P < .01. Notwithstanding the difference in the volume of activation, one is still able to identify the motor cortex on the side with the tumor. The motor cortex on the right is displaced anteriorly and superiorly by the tumor mass. The accessory motor area is seen at the midline in the superiormost image (bottom right)
