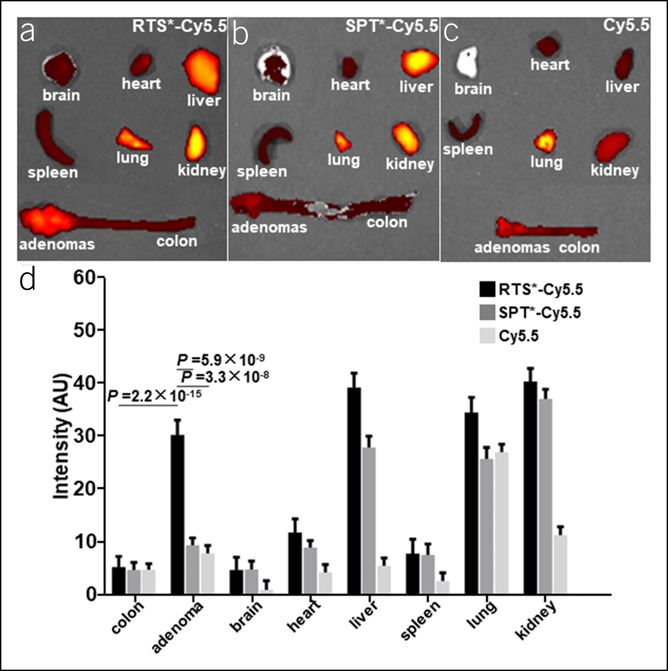
Figure 4.

Biodistribution of claudin-1 peptide. Fluorescence images show uptake of (a) RTS*-Cy5.5 (n = 6), (b) SPT*-Cy5.5 (n = 6), and (c) free Cy5.5 (n = 3) in major organs of CPC;Apc mice at ∼1 hour after injection. (d) The mean (±SD) fluorescence intensity is significantly greater for RTS*-Cy5.5 vs either SPT*-Cy5.5 or Cy5.5 in adenoma and for adenoma vs normal colon with RTS*-Cy5.5. Intensities were log-transformed and fit to an ANOVA model using terms for 24 means (3 groups, 8 tissues) and mouse effects.
