Figure 6.
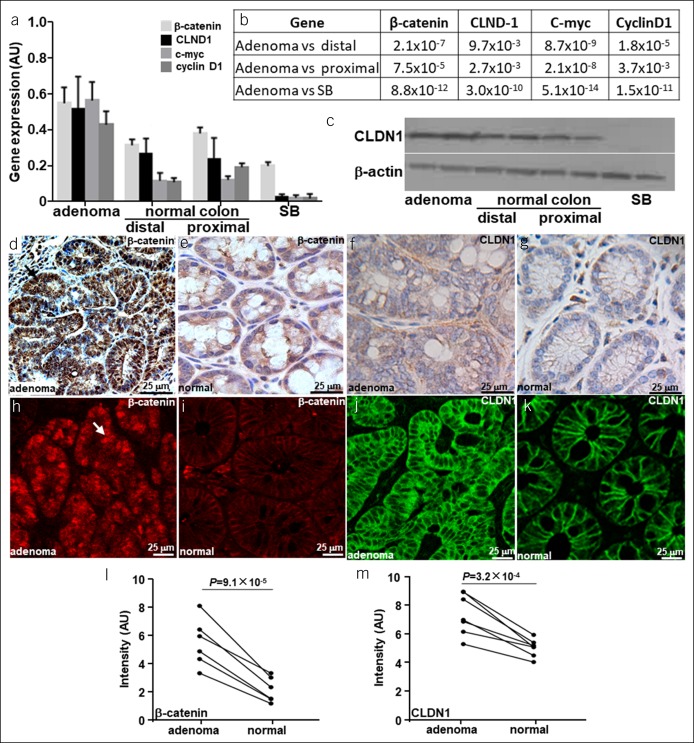
Regulation of claudin-1 expression. (a) Mean (±SD) gene expression of β-catenin, claudin-1 (CLDN1), c-myc, and cyclin D1 is increased in adenoma vs either normal colon (proximal and distal) or small bowel (SB) using RT-PCR. (b) P values are shown for each comparison. (c) Western blot confirms increased claudin-1 expression in adenoma vs normal colon and SB. Strong reactivity for β-catenin is seen in the nuclei (arrow) of (d) adenoma vs (e) normal with immunohistochemistry (IHC), and increased staining for CLDN1 is seen on the membrane of adenoma (f) vs normal (g). (h–k) These results are supported using immunofluorescence and for claudin-1. The mean (±SD) intensities for (l) anti–β-catenin and (m) anti-CLDN1 antibodies are significantly greater for adenoma vs normal using the paired t test, n = 6 per group.

