
fig 2.
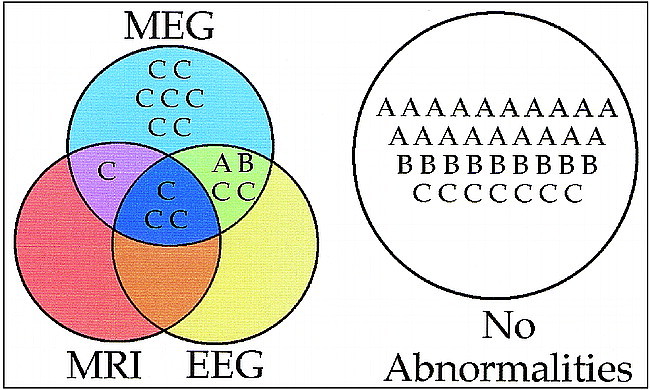
Summary of initial neuroimaging data from all subjects. Group A represents the normal control subjects, group B is the asymptomatic head trauma subjects, and group C is the symptomatic head trauma patients. The set diagram shows what diagnostic tests, if any, provided abnormal findings for each subject. Of particular note are the low false-positive rates for group A and B subjects (all without symptoms), the high sensitivity of MEG to abnormalities in patients with postconcussive symptoms, and the finding that MEG identified abnormalities in all group C subjects who had MR imaging or EEG abnormalities plus seven additional group C subjects who had normal MR imaging and EEG findings