
fig 1.
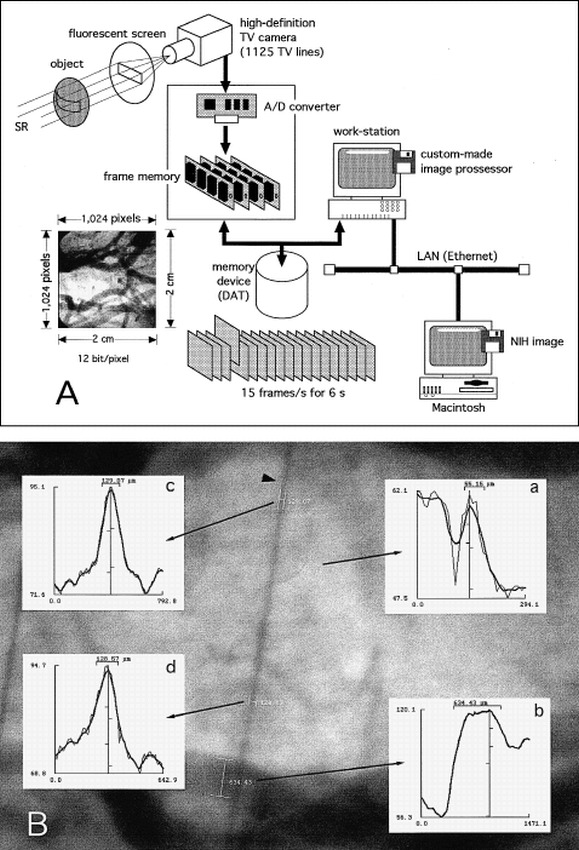
A, Schematic representation of the experimental set-up. DAT indicates digital audiotape; LAN, local area network; SR, synchrotron radiation.
B, An example of the method used to measure vessel diameters. Radiographic image shows cerebral vessels and a reference copper wire with a diameter of 130 μm (arrowhead). The mean density profiles (thin lines) and the running averaged mean density profiles (thick lines) for the two measured vessels (a and b) and the two sites of the reference wire (c and d) are shown. The diameter is calculated on the basis of the distance between the edges, which are defined as the two half-maximum points of the profile (see Methods). Ordinate represents density; abscissa, distance (μm). The measured value of the reference wire is approximately 130 μm. This angiogram was made from figure 2.