
fig 2.
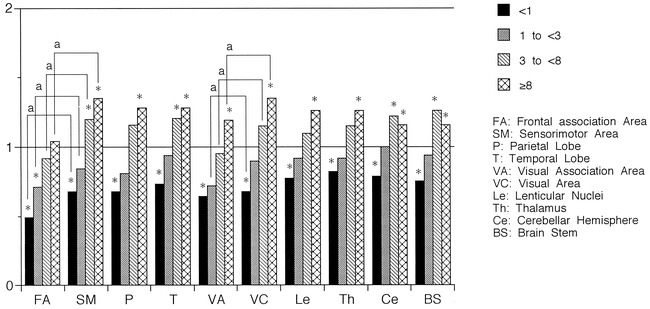
The ratio of rCMRO2 values to those in adults distributed by age. rCMRO2 values increased with development in all areas but the ratio of increase was smaller than that of rCBF. The last increase was observed in the frontal association area. The ratio increased to more than one at a later age compared with that of rCBF. Compared with rCMRO2 values in adults, low values were observed in all areas in the <1-year-old age group and in the frontal association area in the 1- to <3-year-old group, whereas rCMRO2 values were significantly increased in the sensorimotor area, visual area, temporal lobe, cerebellar cortex, and brain stem in the 3- to <8-year-old group and in all areas in the ≥8-year-old group, except for the frontal association area. rCMRO2 values were always lower in the association areas than in the primary areas, except for those in the visual association area and the visual area in the <1-year-old group. Asterisk indicates Mann-Whitney U-test, P < .05; a, paired t-test, P < .05