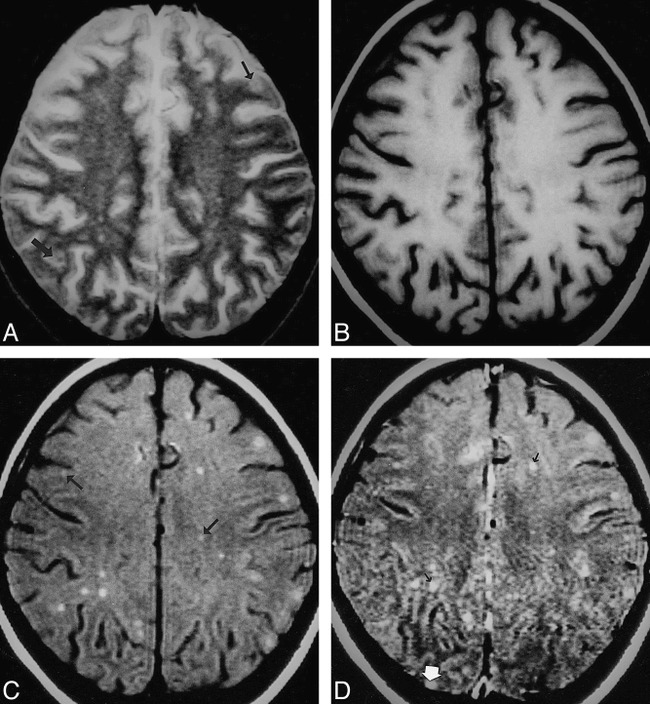
fig 6.

Multiple tuberculomas.
A–D, T2-weighted (A), T1-weighted (B), MT-SE T1-weighted (C), and postcontrast MT-SE T1-weighted (D) images. In A, image through the supraventricular region shows subtle areas of hypointensity with a hyperintense rim (arrow) in the cortex and subcortical white matter. In B, these lesions are isointense with the parenchyma. In C, the lesions seen in A have a hyperintense rim with subtle or no hypointense core. The other lesions seen as hyperintense dots in the subcortical and deep white matter (arrow) are not visible in A. In D, the hyperintensity is increased in some of the lesions (black arrow); however, one lesion in the right occipital cortex, which shows enhancement (white arrow), was not visible on A, B, or C.
