
fig 2.
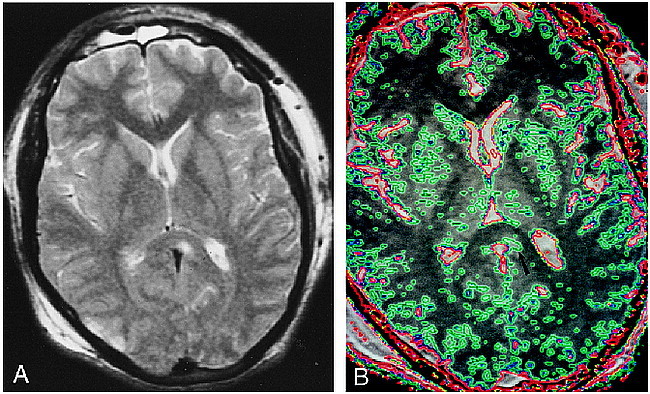
A, Axial T2-weighted (2500/90/1) image depicts a well-circumscribed nonhemorrhagic lesion in the splenium of the corpus callosum. There is also a small contusion in the right occipital cortex.
B, Contour plot applied to magnetization transfer map. Region of MTR abnormality is also shown to be well circumscribed and does not exceed the boundaries of the signal abnormality seen on the T2-weighted image (arrow). Area encircled with green depicts region with MTR less than 0.39 (blue = 0.35; red = 0.32). The MTR associated with normal gray matter is lower than that associated with normal white matter. The blue and green contours seen in the cortex, the basal ganglia, and the thalami do not represent areas of abnormality.