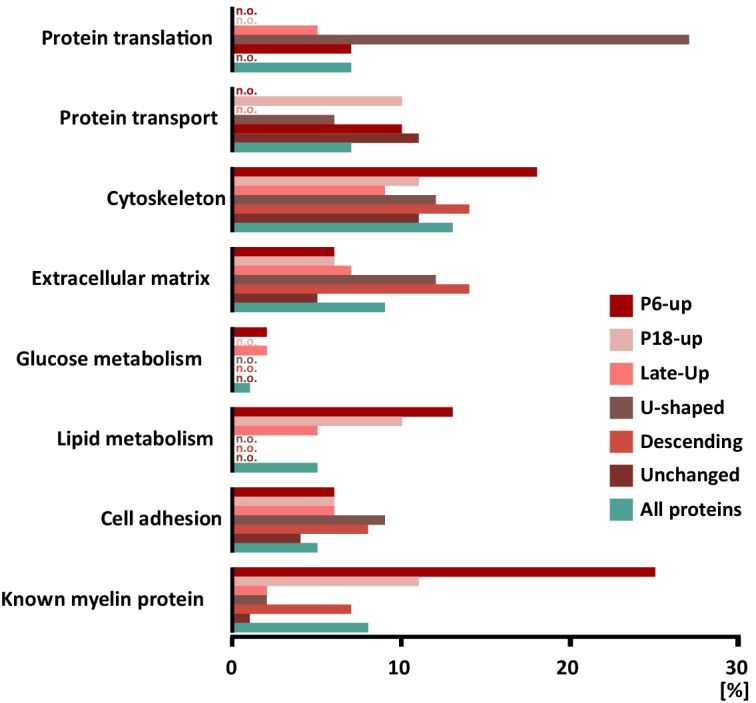
Figure 4. Categorization of annotated protein functions.

All proteins identified in peripheral myelin by UDMSE (turquoise) and the respective developmental expression clusters (Figure 3; shades of red) were analyzed for overrepresented functional annotations using gene ontology (GO) terms. The graph displays the percentage of proteins in each cluster that were annotated with a particular function. For comparison, known myelin proteins were annotated. n.o., not over-represented.
