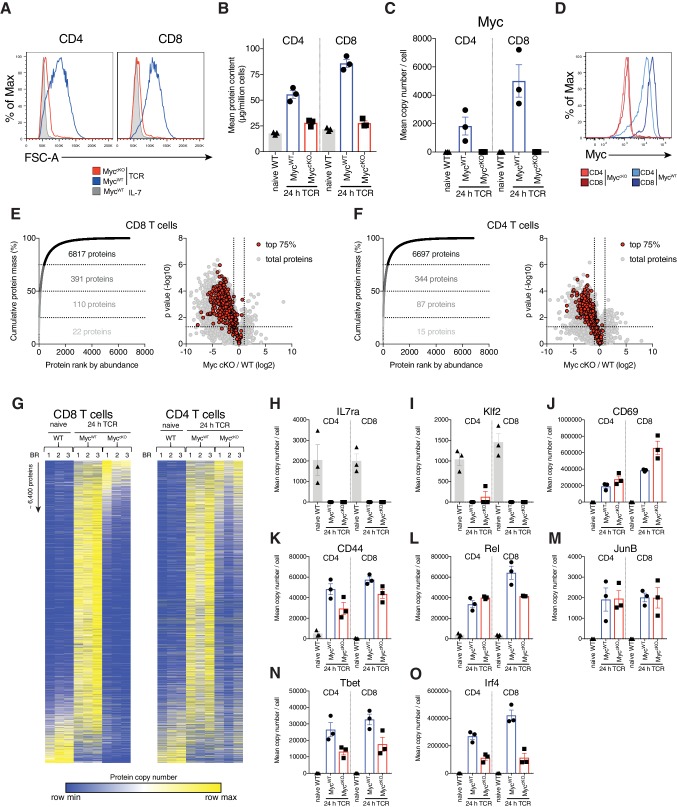
Figure 1. Myc controls cell growth by selectively remodelling T cell proteomes.
(A) Forward scatter area (FSC-A) of IL-7 maintained or 24 hr anti-CD3 + anti-CD28 (TCR) activated Cd4Cre+ (MycWT) and Cd4Cre+Mycfl/fl (MyccKO) T cells. (B–C, E–O) Quantitative proteomics data of ex vivo naïve WT and 24 hr TCR activated CD4+ and CD8+ T cells from MycWT and MyccKO mice. (B) Total protein content (µg/million cells). (C) Mean protein copy number per cell estimated using proteomic ruler (Wiśniewski et al., 2014) of Myc. (D) Myc expression measured by flow cytometry in 24 hr TCR activated MycWT and MyccKO CD4+ and CD8+ T cells. Proteins from 24 hr TCR activated MycWT (E) CD8+ and (F) CD4+ T cells were ranked by mass contribution and the mean cumulative protein mass was plotted against protein rank (left panel). Numbers in each quartile indicate total proteins summed with those in the quartiles below. Volcano plots show foldchange in protein copy number between TCR activated MyccKO and MycWT T cells, with proteins that contribute the top 75% of the T cell mass shown in red (right panel). (G) Heat maps of naïve and TCR activated MycWT and MyccKO CD8+ and CD4+ proteomes. Relative protein abundance is graded from low (blue) to high (yellow) per row. Input data for heatmaps is listed in Supplementary file 1. Mean protein copy number per cell for activation markers (H) IL7ra (J) CD69 and (K) CD44 and key transcription factors (I) Klf2, (L) Rel, (M) JunB, (N) Tbet, and (O) Irf4. Symbols on bar charts represent biological replicates: error bars show mean ± S.E.M. Quantitative proteomics was performed on biological triplicates. Fold-change calculations and statistical testing comparing naïve WT vs TCR MycWT, naïve WT vs TCR MyccKO, and TCR MycWT vs TCR MyccKO protein copy number per cell is listed in Supplementary file 1.
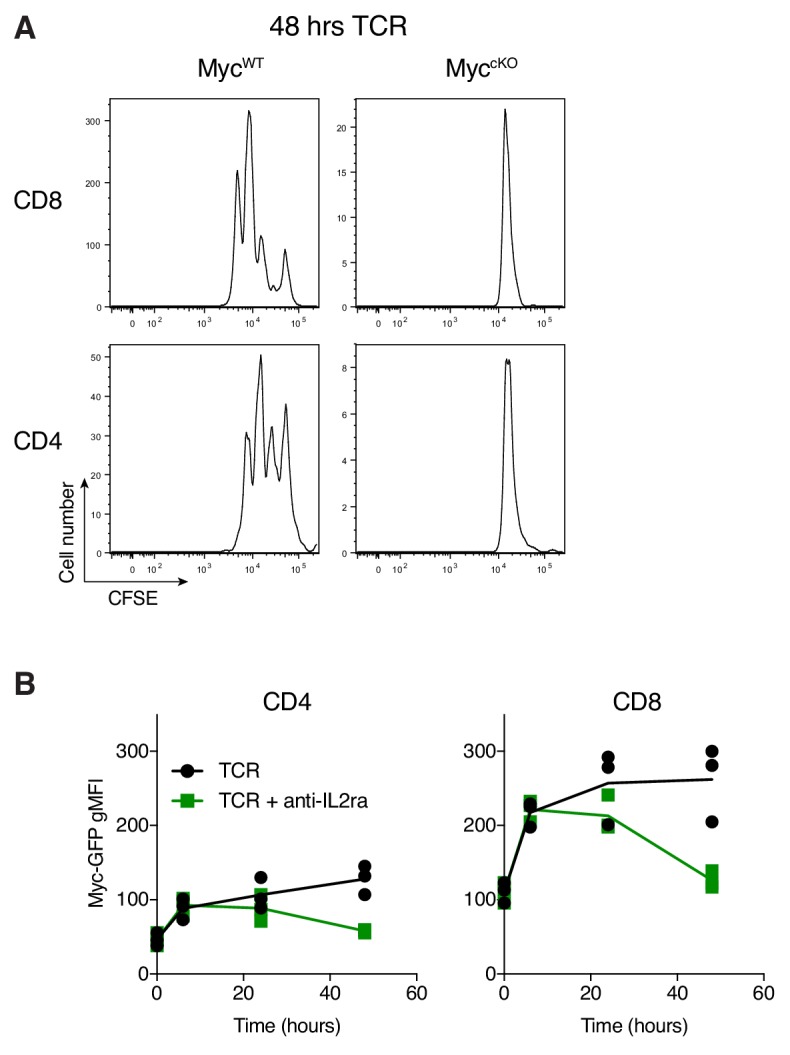
Figure 1—figure supplement 1. Immune activated Myc-deficient T cells fail to proliferate.


