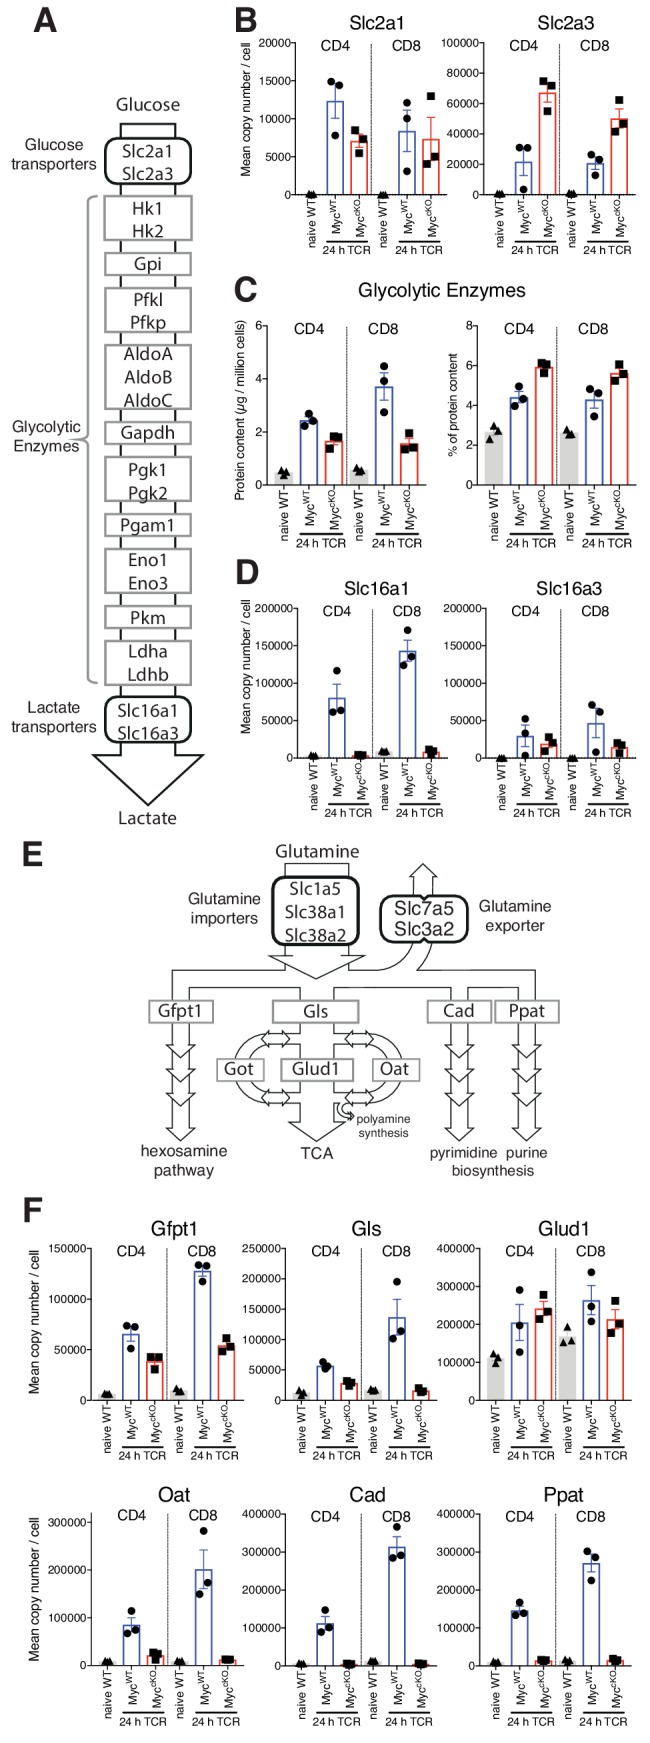
Figure 2. Myc control of T cell metabolism is selective.

Naïve WT and 24 hr TCR activated MycWT and MyccKO CD4+ and CD8+ T cell proteomic data was generated as described in Figure 1 and Materials and methods. (A) schematic of nutrient transporters and enzymes involved in glycolysis. (B) Mean copy number per cell for glucose transporters Slc2a1 and Slc2a3. (C) Total protein content (µg/million cells) (left panel) and % contribution to total cellular protein mass (right panel) of total glycolytic enzymes. (D) Mean protein copy number per cell for lactate transporters Slc16a1 and Slc16a3. (E) Schematic of transporters and enzymes involved in Glutamine transport and metabolism. (F) Mean copy number per cell for major enzymes involved in glutamine metabolism. Symbols on bar charts represent biological replicates from biological triplicate data, error bars show mean ± S.E.M. Fold-change calculations and statistical testing comparing naïve WT vs TCR MycWT, naïve WT vs TCR MyccKO, and TCR MycWT vs TCR MyccKO protein copy number per cell is listed in Supplementary file 1.
