
Figure 3. Myc induces amino acid transporter expression, a critical step for proteome remodelling.
Naïve WT and 24 hr TCR activated MycWT and MyccKO CD4+ and CD8+ T cell proteomic data was generated as described in Figure 1 and Materials and methods. (A) Mean copy number per cell of abundant amino acid transporters in T cells. (B) Fold-change in amino acid transporter protein copy number from naïve WT to 24 hr TCR activated MycWT and MyccKO, mean (min, max). Transport by system L amino acid transporters was measured by uptake of fluorescent (emission 450 nm when excited at 405 nm) Tryptophan metabolite, Kynurenine (Kyn) (Sinclair et al., 2018) in (C) 2 hr IL-7 maintained and (D-E) 4 hr IL-7 maintained or TCR activated splenic CD4+ and CD8+ WT, MyccKO and Slc7a5cKO T cells or (F) 20 hr TCR activated Myc-GFP reporter CD4+ T cells. In (C,E) system-L uptake is represented as the ratio of BCH (a system L inhibitor) untreated: treated T cells. In (E) dotted line indicates Slc7a5cKO uptake level. (G) Forward scatter and CD69 expression of IL-7 maintained or 24 hr TCR activated wild-type and Slc7a5cKO (Cd4Cre+ Slc7a5fl/fl) T cells. (H-K) Quantitative proteomics data of naïve WT and 24 hr TCR activated CD4+ and CD8+ T cells from Ly5.1 (Slc7a5WT) and Slc7a5cKO mice. Baseline naïve WT data is the same as used for the MyccKO dataset. (H) Total protein content (µg/million cells). (I) Heat map of naïve and TCR activated Slc7a5WT and Slc7a5cKO CD4+ T cell proteomes. Relative protein abundance is graded from low (blue) to high (yellow) per row. Input data for heatmaps is listed in Supplementary file 1. (J) Venn diagram showing the overlap in TCR regulated proteins that are more than 2-fold regulated and p<0.05 in MycWT vs MyccKO and Slc7a5WT vs Slc7a5cKO TCR activated CD4+ T cells. (K) Volcano plots of TCR regulated proteins comparing Slc7a5WT and Slc7a5cKO datatsets. Proteins > 2 fold different between MycWT and MyccKO TCR activated T cells are highlighted in red; proteins reduced in the MyccKO (left panel), proteins higher MyccKO (right panel). Symbols in bar charts represent biological replicates: error bars show mean ± S.E.M. Dot plot in (F) is representative of biological triplicate data. Quantitative proteomics was performed on biological triplicates. Fold-change calculations and statistical testing comparing naïve WT vs TCR MycWT, naïve WT vs TCR MyccKO, TCR MycWT vs TCR MyccKO, naïve WT vs TCR Slc7a5WT, naïve WT vs TCR Slc7a5cKO and TCR Slc7a5WT vs TCR Slc7a5cKO protein copy number per cell is listed in Supplementary file 1.

Figure 3—figure supplement 1. Myc-deficient T cells fail to induce protein translation machinery.
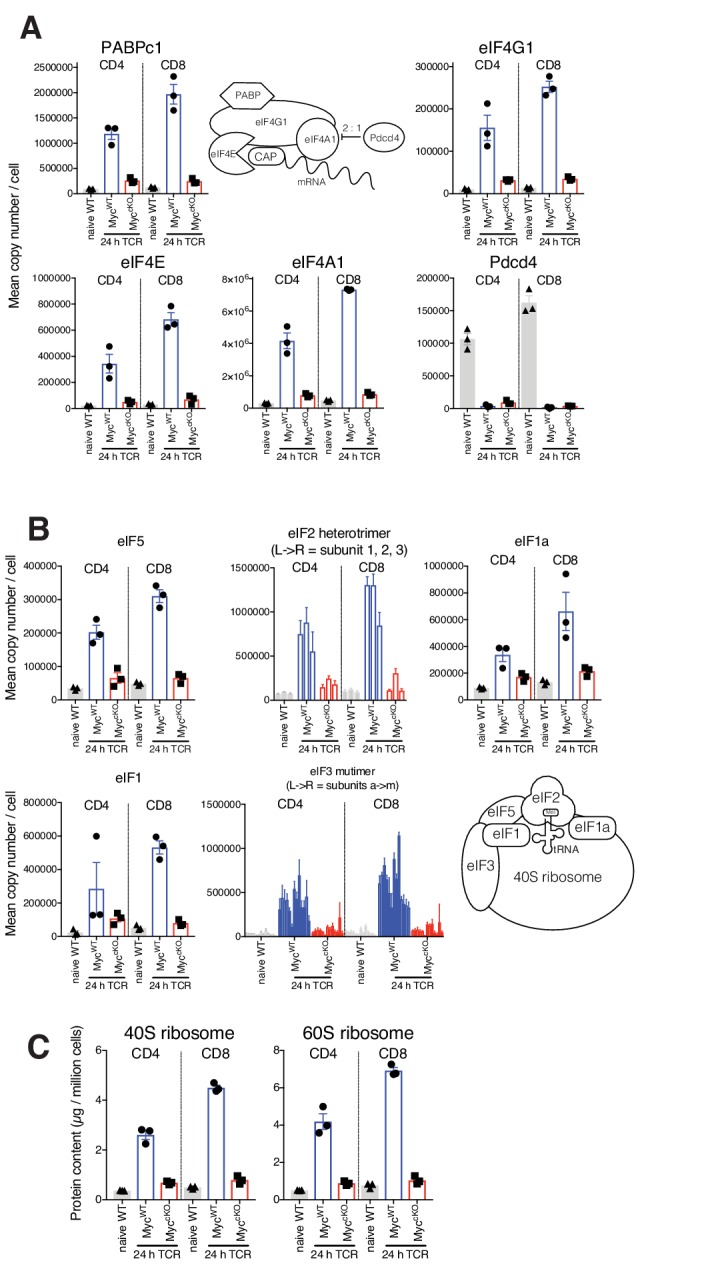
Figure 3—figure supplement 2. Amino acid transport capacity corresponds with transporter number.
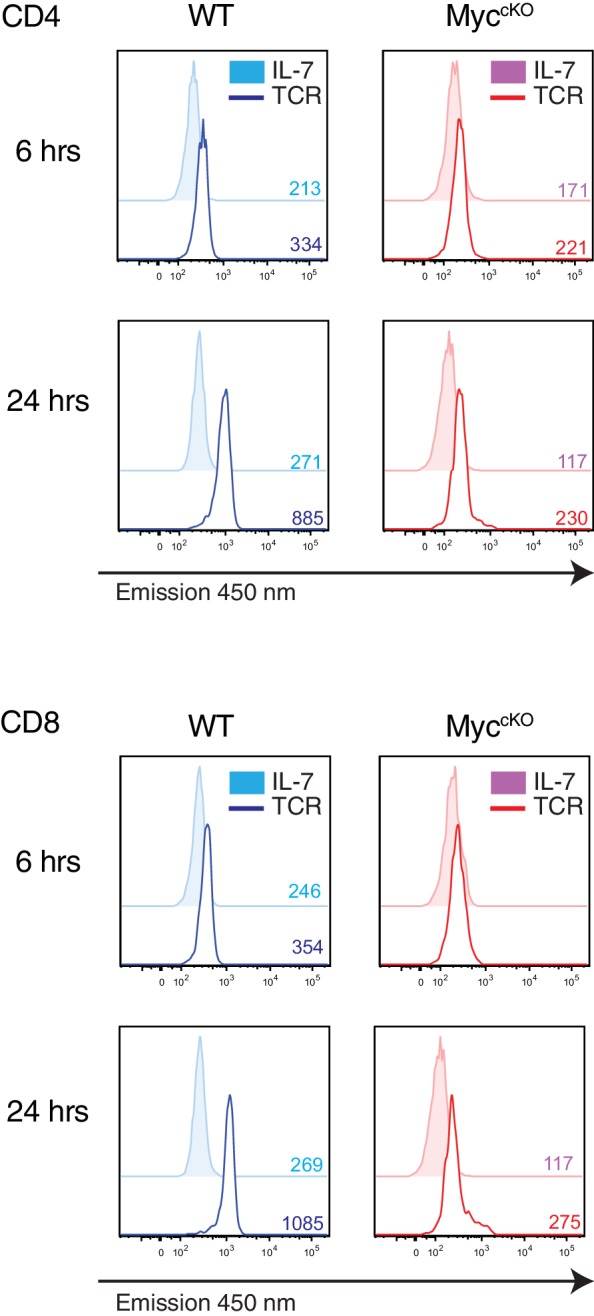
Figure 3—figure supplement 3. Myc-deficient T cells fail to induce Branched-chain amino acid and Methionine metabolism.

Figure 3—figure supplement 4. Ribosome expression is reduced in both Myc and Slc7a5 deficient T cells, but other proteins are differentially regulated between Myc and Slc7a5 deficient T cells.
