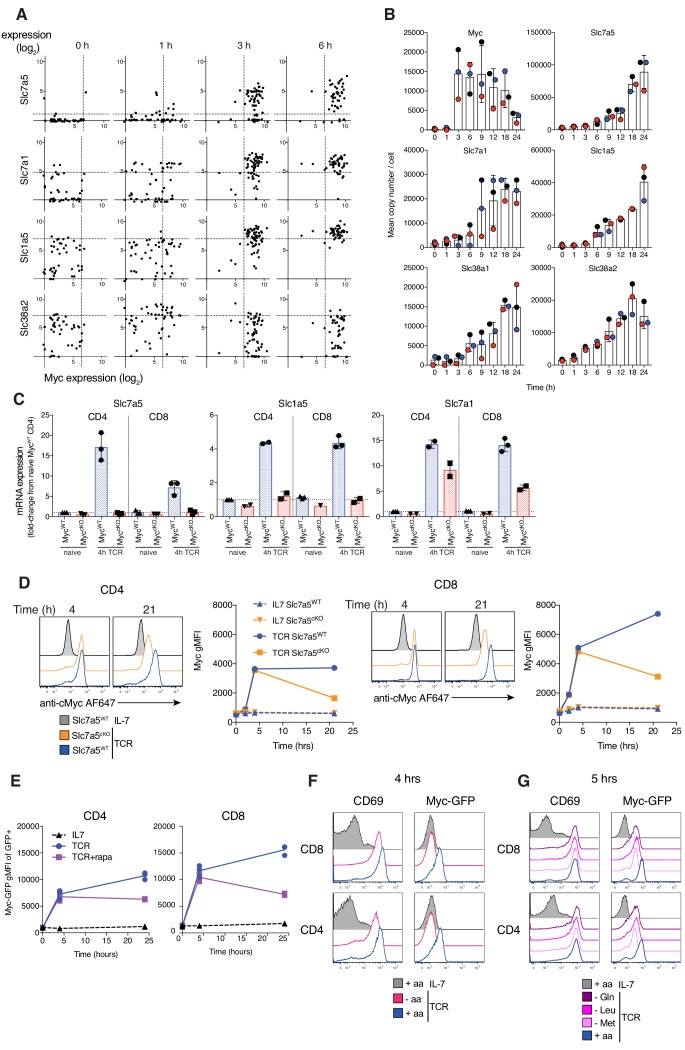
Figure 4. Myc induces amino acid transport early after TCR activation, triggering a feedforward loop maintaining its own expression.
(A) Expression levels of Slc7a5, Slc7a1, Slc1a5 and Slc38a2 vs Myc mRNA from published single cell RNAseq dataset of OT1 T cells stimulated with SIINFEKL (N4) peptide for the indicated times (Richard et al., 2018). Dotted lines represent 95th percentile of 0 hr gene expression. Symbols represent individual cells (B) Quantitative proteomics of OT-I CD8+ T cells activated with N4 peptide for the indicated time. Mean copy number per cell of the proteins Myc, Slc7a5, Slc7a1, Slc1a5, Slc38a1 and Slc38a2. (C) Slc7a5, Slc1a5 and Slc7a1 mRNA measured by qPCR from ex vivo naïve or 4 hr TCR activated lymph node CD4+ and CD8+ T cells. mRNA levels are relative to naïve CD4+ T cells. (D) Histograms and geometric mean fluorescence intensity (gMFI) vs time of Myc protein measured with antibody by flow cytometry in IL-7 maintained or TCR activated Slc7a5WT and Slc7a5cKO lymph node CD4+ and CD8+ T cells. Representative of 4 biological replicates. (E) Myc-GFP gMFI in IL-7 maintained or GFP+ TCR activated CD4+ and CD8+ T cells ± rapamycin from lymph nodes of Myc-GFP reporter mouse. Myc-GFP reporter expression in CD4+ and CD8+ T cells maintained in IL-7 or TCR activated in (F) amino-acid free media (-aa, HBSS), vs RPMI (+aa) or (G) media deficient in a single amino acid. Data representative of at least three biological replicates. Symbols unless otherwise stated represent biological replicates. Mean ± S.E.M. Quantitative proteomics was performed on biological triplicates.

