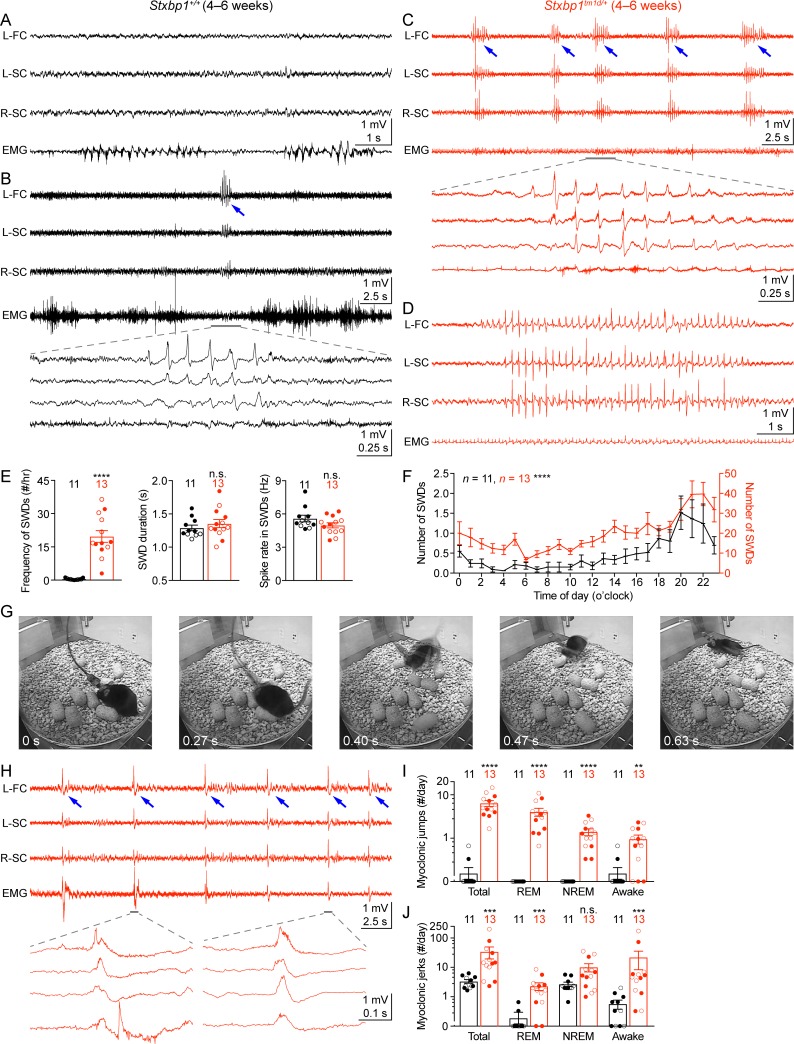
Figure 6. Stxbp1tm1d/+ mice exhibit cortical hyperexcitability and epileptic seizures.
(A–D) Representative EEG traces of the left frontal cortex (L-FC), left somatosensory cortex (L-SC), and right somatosensory cortex (R-SC), and EMG traces of the neck muscle from WT (A,B) and Stxbp1tm1d/+ mice (C,D). Spike-wave discharges (SWDs, indicated by the blue arrows) occurred frequently and often in a cluster manner in Stxbp1tm1d/+ mice (see Video 1). The gray line-highlighted SWDs from WT and Stxbp1tm1d/+ mice were expanded to show the details of the oscillations (B,C). A long SWD (i.e.,>4 s) during REM sleep from a Stxbp1tm1d/+ mouse is shown in (D) (see Video 2). (E) Summary data showing the overall SWD frequency (left panel), duration (middle panel), and average spike rate (right panel). (F) The numbers of SWDs per hour in WT (left Y axis) and Stxbp1tm1d/+ (right Y axis) mice are plotted as a function of time of day and averaged over 3 days. (G) Video frames showing a myoclonic jump from a Stxbp1tm1d/+ mouse (see Video 3). The mouse was in REM sleep before the jump. (H) Representative EEG and EMG traces showing myoclonic jerks (indicated by the blue arrows) from a Stxbp1tm1d/+ mouse (see Video 4). Two episodes of myoclonic jerks highlighted by the gray lines were expanded to show that the EEG discharges occurred prior to (the first episode) or simultaneously with (the second episode) the EMG discharges. (I,J) Summary data showing the frequencies of two types of myoclonic seizures in different behavioral states. The numbers and ages of recorded mice are indicated in the figures. Each filled (male) or open (female) circle represents one mouse. Bar graphs are mean ± s.e.m. n.s., p>0.05; **, p<0.01; ***, p<0.001; ****, p<0.0001.


