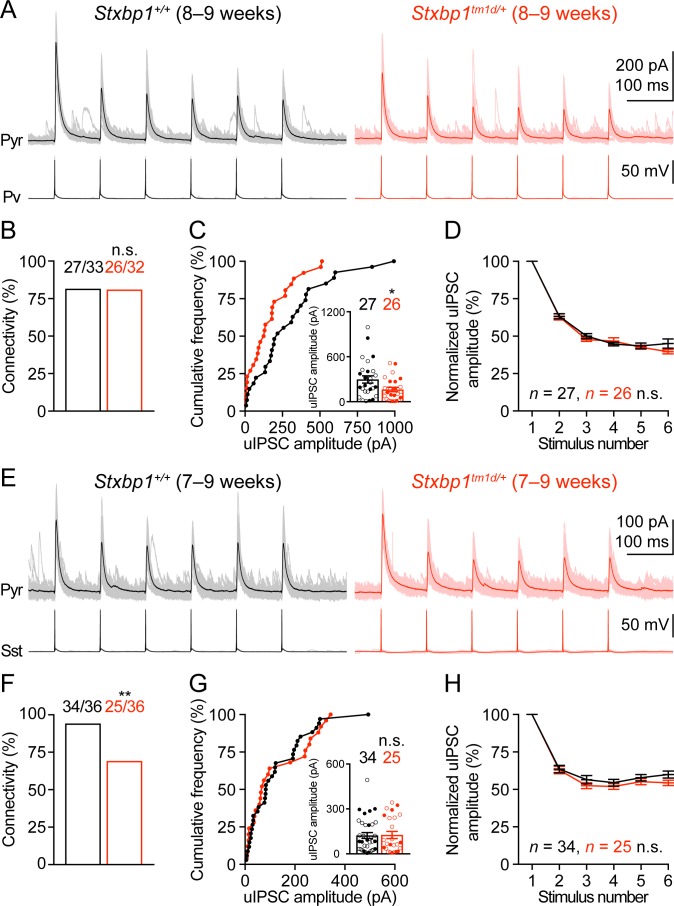
Figure 8. Inhibitory synapses from Pv and Sst interneurons are differentially impaired in Stxbp1tm1d/+ mice.
(A) uIPSCs of a layer 2/3 pyramidal neuron (Vm = + 10 mV) in the somatosensory cortex (upper panels) evoked by a train of 10 Hz action potentials in a nearby Pv interneuron (lower panels) from WT and Stxbp1tm1d/+ mice. 50 individual traces (lighter color) and the average trace (darker color) are superimposed. Note smaller uIPSCs in the Stxbp1tm1d/+ neuron. (B) Unitary connectivity rates from Pv interneurons to pyramidal neurons were similar between WT (27 connections out of 33 pairs) and Stxbp1tm1d/+ (26 connections out of 32 pairs) mice. (C) Cumulative frequencies of uIPSC amplitudes evoked by the first action potentials in the trains (median: WT, 217.3 pA; Stxbp1tm1d/+, 127.1 pA). Inset, each filled (male) or open (female) circle represents the uIPSC amplitude of one synaptic connection. (D) uIPSC amplitudes during the trains of action potentials were normalized by the amplitudes of the first uIPSCs. Note the similar synaptic depression between WT and Stxbp1tm1d/+ neurons. (E–H) Similar to (A–D), but for Sst interneurons. Unitary connectivity rates from Sst interneurons to pyramidal neurons (F) in Stxbp1tm1d/+ mice (25 connections out of 36 pairs) were less than WT mice (34 connections out of 36 pairs). The uIPSC amplitudes evoked by the first action potentials in the trains (G, median: 83.5 pA and 68.0 pA, respectively) and synaptic depression (H) were similar between WT and Stxbp1tm1d/+ mice. The ages of mice are indicated in the figures. Bar graphs are mean ± s.e.m. n.s., p>0.05; *, p<0.05; **, p<0.01.


