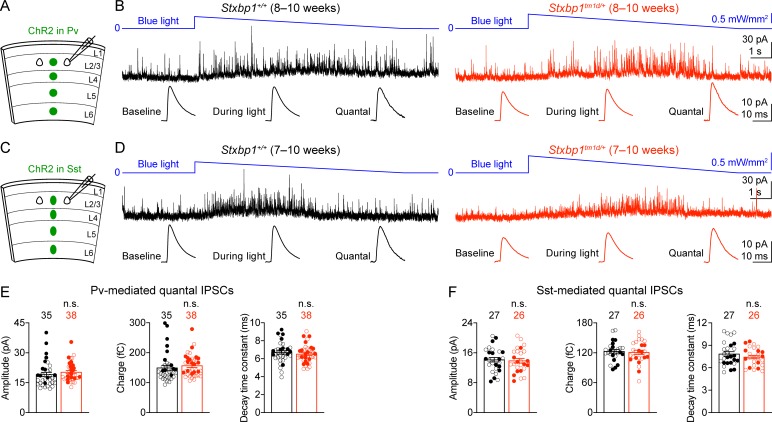
Figure 9. Pv and Sst interneurons-mediated quantal IPSCs are isolated by a novel optogenetic method and are unaltered in Stxbp1tm1d/+ mice.
(A) Schematic of slice experiments in (B). ChR2 in Pv interneurons. (B) mIPSCs in a layer 2/3 pyramidal neuron (Vm = + 10 mV) from the somatosensory cortex of WT or Stxbp1tm1d/+ mice. The intensity of blue light is indicated above the mIPSC traces. Note the increase of mIPSC frequency during blue light stimulation. The quantal IPSC trace was computed by subtracting the average mIPSC trace of the baseline period from that of the light stimulation period (bottom row). (C,D) As in (A,B), but for ChR2 in Sst interneurons. (E,F) Summary data showing that the average amplitude, charge, and decay time constant of Pv (E) or Sst (F) interneuron-mediated quantal IPSCs are similar between WT and Stxbp1tm1d/+ mice. The numbers and ages of recorded neurons are indicated in the figures. Each filled (male) or open (female) circle represents one neuron. Bar graphs are mean ± s.e.m. n.s., p>0.05.


