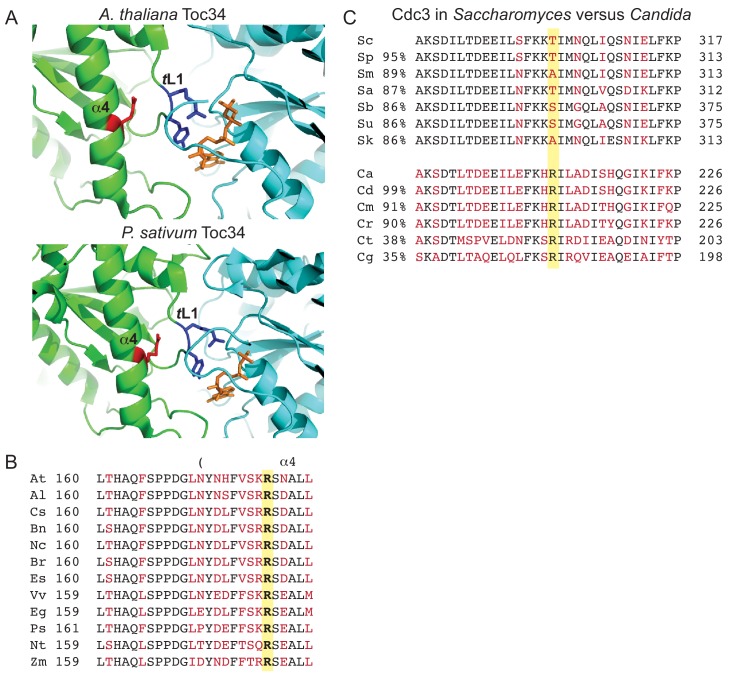
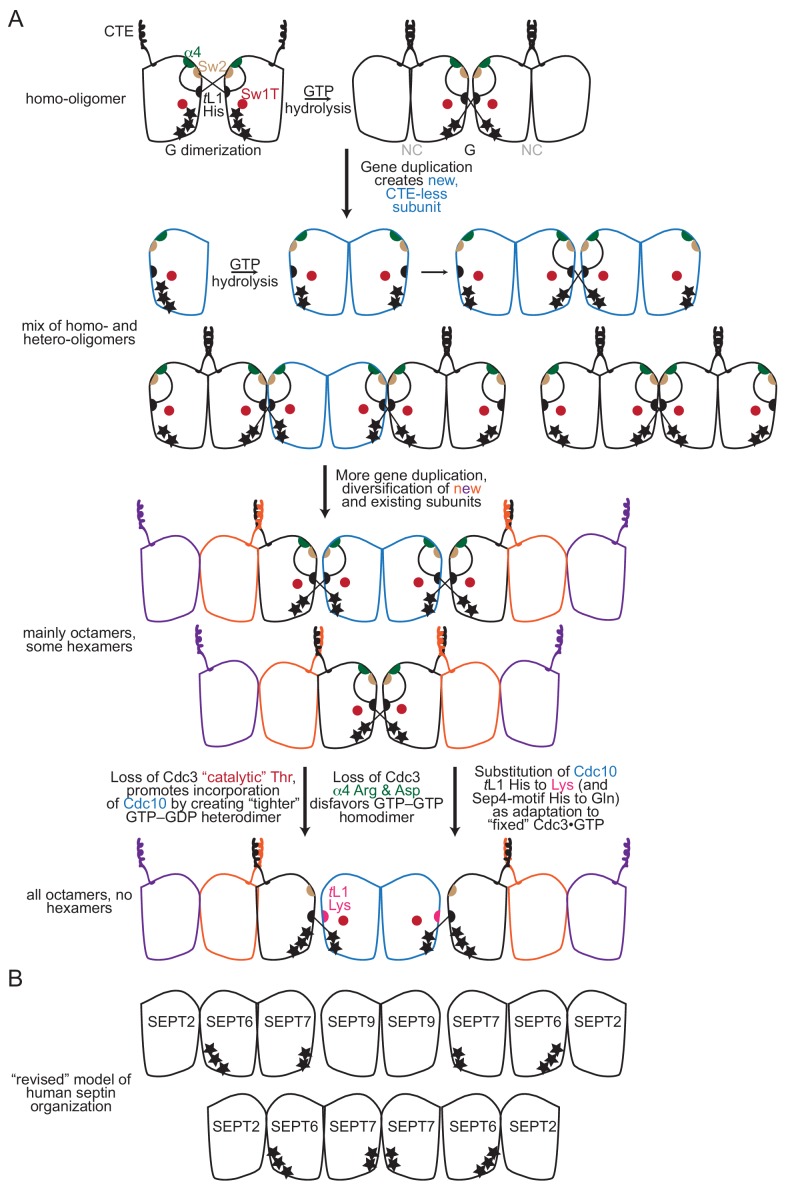
Figure 9. Conservation of contacts between α4 Arg and trans loop 1 in the distant septin relative Toc34 and among Candida species, and drift at the α4 Arg position in Saccharomyces species.
(A) Structures of homodimer interface of Toc34 from Arabidopsis thalianai (GppNHp-bound, PDB 3bb3, top) and Pisum sativum (GDP-bound, PDB 1h65, bottom) with nucleotide in orange, α4 Arg in red and nucleotide-contacting trans loop 1 (‘TL1’) residues in blue. (B) Sequence alignment of a region in and around the α4 helix of Toc34 homologs in various plant species, with identical and variable amino acids in black and red, respectively, and the α4 Arg in bold. A. thaliania, At (NP_196119); A. lyrata, Al (XP_002873181); Camelina sativa, Cs (XP_010423506); Brassica napus, Bn (CDX98810); Noccaea caerulescens, Nc (JAU73517); B. rapa, Br (XP_009130855); Eutrema salsugineum, Es (XP_006398957); Vitis vinifera, Vv (XP_002274573); Eucalyptus grandis, Eg (XP_010063039); P. sativum, Ps (Q41009); Nicotiana tabacum, Nt (XP_016456518); Zea mays, Zm (ACG34570). (C) Sequence alignments of a region surrounding ScCdc3 Thr302 (highlighted in yellow), with identical and variable amino acids in black and red, respectively. Percent sequence identity over the entirety of Cdc3, relative to ScCdc3 or CaCdc3, is given at left. Alignments of Saccharomyces species were performed using the Saccharomyces Genome Database (http://www.yeastgenome.org). Sc, S. cerevisiae; Sp, S. paradoxus; Sm, S. mikatae; Sa, S. aboricola; Sb, S. bayanus; Su, S. uvarum; Sk, S. kudriavzevii. Candida alignments were performed at the NCBI Blast server. Ca, C. albicans (EEQ42751); Cd, C. dubliniensis (CAX44656); Cm, C. maltosa (EMG46918); Cr, C. tropicalis (XP_002550438); Ct, C. tenuis (EGV60285); Cg, C. glabrata (CAG57768). Figure 9—figure supplement 1 presents a speculative model for how the position corresponding to ScCdc3 Thr302 and other relevant molecular features may have changed during septin evolution.


