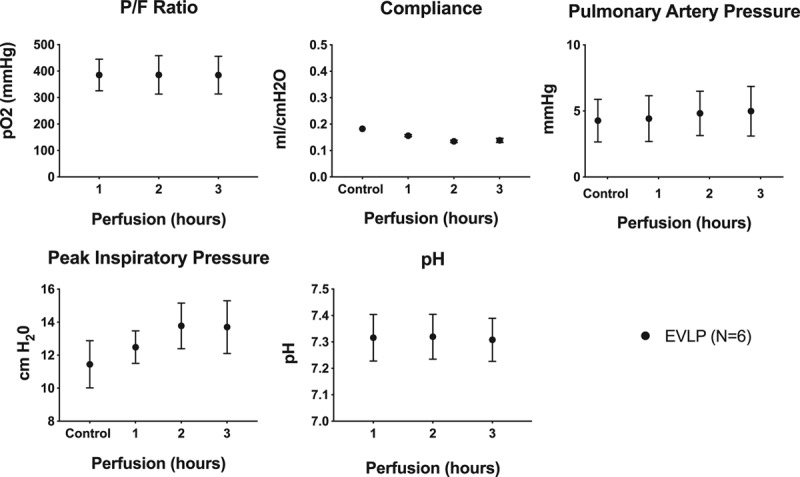
FIGURE 5.

Lung function during EVLP. A, P/F ratio, (B) pulmonary arterial pressure, (C) lung compliance, and (D) peak airway pressure were measured hourly during EVLP. Data are represented as mean ± SEM. EVLP, ex vivo lung perfusion; P/F, partial pressure of oxygen/fraction of inspired oxygen; SEM, standard error of the mean.
