FIGURE 6.

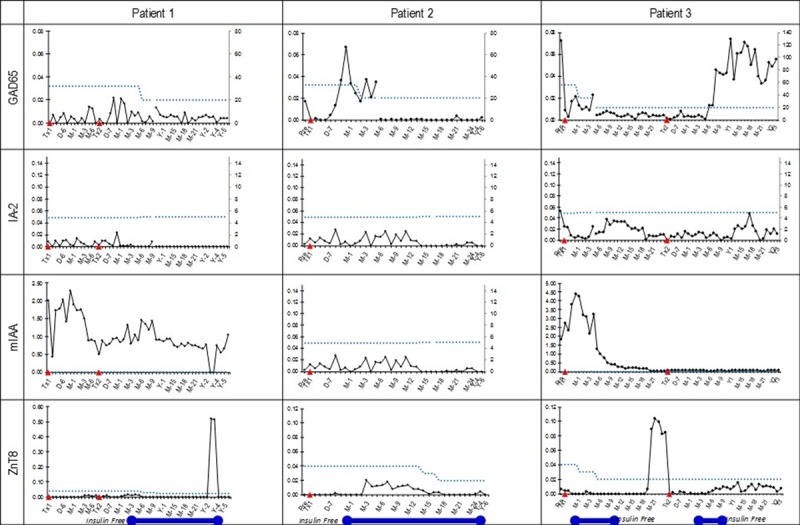
Trends of islet autoantibodies in follow-up after transplantation. The blue bar represents periods of freedom from insulin. Autoantibody levels showed no correlation with graft function.

Trends of islet autoantibodies in follow-up after transplantation. The blue bar represents periods of freedom from insulin. Autoantibody levels showed no correlation with graft function.