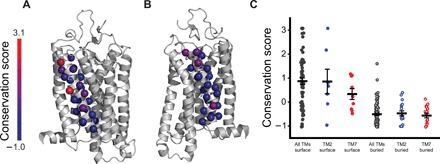
Fig. 6. Evolutionary profiling of residues within the transmembrane domains of rhodopsin.

The sequences of 468 rhodopsins were aligned and analyzed to compare the evolutionary rates of residues within each TM domain. (A) The evolutionary rates associated with each residue within TM2 were converted into conservation scores and mapped onto a structural model of rhodopsin. (B) The evolutionary rates associated with each residue within TM7 were converted into conservation scores and mapped onto a structural model of rhodopsin. (C) The conservation scores associated with the surface (closed circles) and buried (open circles) residues within all of the TM domains of rhodopsin (gray) are compared to those within TMs 2 (blue) and 7 (red), specifically. The average conservation score associated with each distribution is plotted, along with whiskers showing the standard error plotted for reference.
