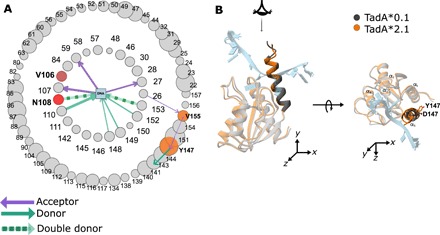
Fig. 4. Asteroid plot analysis of second-generation mutations.

(A) The first and second interaction shell around the three nucleotides in the active site of the TadA*2.1-ssDNA complex. The size of the node corresponds to the time in which the amino acid resides in the first/second shell. First round mutations are red, and second round mutations are orange. (B) Structural overlay of average structure of TadA*0.1-ssDNA and TadA*2.1-ssDNA complexes. This α5 helix has been highlighted to depict its overall movement toward the active site upon Asp147Tyr mutation.
