
Fig. 1. Film technology stabilizes live microorganisms and biological compounds for extended periods of time at ambient temperatures.
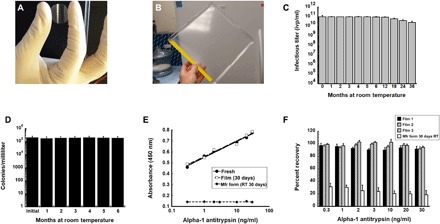
(A) Prototype unit dose film useful for the assessment of long-term stability as described in this manuscript. (B) Prototype large-scale film that can be used for stockpiling and storage and sectioned into multiple single-dose films for distribution. (C) Thirty-six-month stability profile of recombinant adenovirus in solid film matrix. Replicate films (n = 5 per time point) were stored at 20°C, reconstituted with sterile water and infectious titer assessed with a standard limiting dilution assay (19). ivp, infectious virus particles. (D) Six-month stability profile of film containing live bacteria at 20°C. Films (n = 5 per time point) were reconstituted with sterile saline, and solutions were plated on nutrient rich agar. Colonies were counted for assessment of recovery of live bacteria from the film. (E) Binding affinity of primary antibody (178260, Millipore) stabilized in thin film and stored at room temperature (RT) for 30 days is superior to that of the manufacturer’s product stored as a liquid under the same conditions. Solutions made from rehydrated films were used in an alpha-1 antitrypsin (A1AT) enzyme-linked immunosorbent assay (ELISA) assay in triplicate as described (59). Correlation coefficients (r2) for standard curves made with fresh stock stored at 4°C (fresh), antibody reconstituted from film after storage for 30 days at 20°C (film), and antibody stored in the manufacturer’s liquid formulation after storage for 30 days at 20°C (Mfr. form) were 0.99, 0.99, and 0.10 respectively. (F) Recovery of binding affinity of AP192P, a donkey anti-mouse IgG antibody, horseradish peroxidase (HRP) conjugate (Millipore) after storage in a thin film at 20°C. Percent recovery is the relative absorbance reading generated by an assay using secondary antibody from reconstituted films with that of fresh stock as supplied by the manufacturer for each given concentration of A1AT standard. Results were also compared with the manufacturer’s stock stored at RT (instead of −20°C as recommended). Each of the bars in the graph represents readings obtained from antibody recovered from three separate films in a given experiment, and data reflect the averages ± SEM of data collected from three separate experiments. Photo credit (A and B): Maria A. Croyle, The University of Texas at Austin.