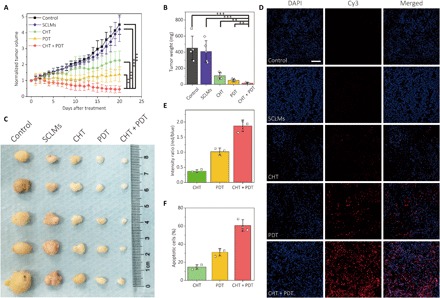
Fig. 6. In vivo antitumor effect of PDT can be greatly promoted by the combination therapy.

(A) Growth rate of A431 tumor xenograft after the treatment of PBS control, blank nanocarrier (SCLMs), CHT, PDT, and combined therapy (CHT + PDT). Data show the mean value and SD of five individual tumors from mice (**P < 0.01, ***P < 0.005). (B) Tumor weights and (C) photos of the tumor mass for each group. Photo credit (C): Junyao Li, China Pharmaceutical University. (D) TUNEL assay of tissue slices collected from the tumor mass on mice after different treatment modalities. The blue fluorescence from DAPI indicates cell nuclei, and the red fluorescence from Cy3 indicates apoptotic cells. Scale bar, 100 μm. (E) Ratios of the integrated intensity between the red fluorescence and the blue fluorescence in the images of TUNEL staining. (F) Ratios of the apoptotic cells determined by fluorescent TUNEL assay. The data were obtained by analyzing three independent confocal images of TUNEL assay with ImageJ.
