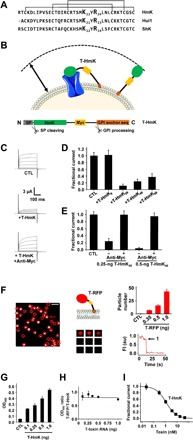
Fig. 1. T-HmK and HmK peptide in solution block KcsA-Shaker channels similarly.

KcsA-Shaker was expressed in oocytes and studied by two-electrode voltage clamp (TEVC) to assess inhibition at equilibrium from a holding voltage of −80 mV with 300-ms test pulses to various voltages and a 5-s interpulse interval (n = 16 to 18 cells for each condition). Live oocytes were studied by ELISA and smTIRF microscopy as described in Materials and Methods. n = 12 oocytes for each condition. Values are means ± SEM. (A) Three SAK1 toxins: HmK, Hui1, and ShK peptide sequences aligned on their three disulfide bonds. (B) T-HmK was constructed as chimeric fusion protein with an N-terminal secretory signal sequence (SP; gray), the HmK sequence (green), a hydrophilic flexible linker with a c-Myc epitope tag (yellow), and a C-terminal GPI membrane anchor targeting sequence (orange). Same colors are used for marking T-HmK components in the above schematic. T-HmK is drawn free and binding to a potassium channel (blue) coexpressed in the same oocyte. The reaction volume that a T-HmK can visit (arrow) is determined by the lengths of the flexible peptide linker, GPI anchor, and the diameter of HmK toxin (Materials and Methods). (C) Representative raw current traces (steps from −80 to 60 mV) for KcsA-Shaker channels without (CTL) or with 0.25-ng T-HmK cRNA coinjection and after incubation with 2 μM anti-Myc to reverse the T-HmK blockade. (D) T-HmK linker variants (0.25 ng of cRNA) show different average KcsA-Shaker currents at 0 mV normalized to control, unblocked (CTL). T-HmK6 has 6 linker residues; T-HmK26 has 26 residues; T-HmK46 has 46 residues; and T-HmK66 has 66 residues. (E) Anti-Myc reverses blockade; KcsA-Shaker currents at 0 mV normalized to control, unblocked (CTL) with 0.25 or 0.5 ng of T-HmK46 cRNA. (F) Left: Single frame from a representative movie showing T-RFP (red fluorescent protein) on an oocyte membrane surface after 1-ng cRNA injection. Red circles mark single fluorescent spots. The white bar indicates 2 μm. Middle top: Schematic representation of T-RFP. Middle bottom: Montage of photobleaching time course of the single fluorescent particle indicated by the arrow in the left panel during continuous excitation to bleach the fluorophores. Every 12th frame is shown. Right bottom: Time course for photobleaching of RFP in the indicated particle, showing one stepwise change in fluorescence intensity (FI) (arrow). au, arbitrary units. Right top: The average number of single particles in 100-μm2 regions are 7 ± 1, 16 ± 2, or 43 ± 5 with 0.35, 0.5, or 1 ng of T-RFP cRNAs injected (n = 12 regions from three oocytes and four areas per oocytes for each condition). No fluorescent particles are observed in oocytes without T-RFP injection. (G) Increasing the amount of T-HmK cRNA injected increases surface expression on Xenopus oocytes. After 2 days of culture, surface expression of T-HmK was determined by ELISA using anti–Myc-HRP (horseradish peroxidase). The tethered control was without the toxin or c-Myc sequences (CTL). OD450, optical density at 450 nm. (H) The ELISA signals for T-RFP and T-HmK shows a stable relationship when the amount of injected cRNA increases. Two separate trials with six oocytes and five concentrations of T-RFP or T-HmK cRNA. (I) Concentration-response relationship for T-HmK (■) inhibition of KcsA-Shaker studied by TEVC and fit to the Hill relationship (Eq. 1). The determined Ki was 1.09 ± 0.01 nM with a Hill coefficient of 1.00 ± 0.01. n = 16 to 18 oocytes for each level of injected T-HmK cRNA. Coinjection of 0.35 ng of cRNA of T-HmK inhibited ~87% of the current, consistent with an effective T-HmK concentration of 7.4 ± 0.8 nM according to Eq. 1, similar to the ~8-nM surface concentration estimated by ELISA and smTIRF (table S1).
