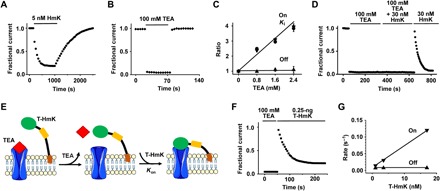
Fig. 2. Measuring the kinetics of T-HmK blockade.

KcsA-Shaker was expressed in oocytes and studied by TEVC as in Fig. 1 with a test potential of 0 mV with 16 to 18 cells for each condition. Values are means ± SEM. (A) The time course for block and unblock of KcsA-Shaker on acute application (bar) of 5 nM peptide HmK and washout. Every 10th data point is shown normalized to the unblocked current magnitude. (B) The time course for block and unblock of KcsA-Shaker on acute application (bar) of 100 mM TEA and washout. (C) The blocking kinetics of 5 nM HmK peptide was studied at various concentrations of TEA in bath solution. Each measured parameter Ki (●), reciprocal on rate association constant (▼), and off rate dissociation constant (▲) were normalized to the value without TEA. Each point represents the mean ± SEM from six oocytes. (D) Unblock of KcsA-Shaker on washout of 100 mM TEA allows subsequent block by 30 nM free HmK peptide. (E) Schematic representation of TEA competition and T-HmK block after TEA wash off. TEA blocks KcsA-Shaker (100 mM) from the outside like HmK and prevents T-HmK binding (left). Unblock by TEA is rapid (τ ~1.3 s), so full current is recorded on washout before significant association of T-HmK due to its slow on rate (τ ~ 33 s with 0.25 ng of T-HmK cRNA) (middle). Thereafter, T-HmK relaxes to equilibrium blockade (right). (F) With T-HmK, TEA wash-off KcsA-Shaker shows full current recovery and slow binding of T-HmK, similar to that seen with free peptide. The T-HmK association constant determined by a single exponential fit of the block time course was τon = 33 ± 4 s. (G) Effect of T-HmK concentration on blocking kinetics of KcsA-Shaker. Three T-HmK concentrations were studied after coinjection of 0.1, 0.25, and 0.5 ng of T-HmK cRNA estimated to represent an effective surface concentration of ~1, 3.5, and 17 nM (table S1). The apparent first-order rate constants for association (on rate, ▼) and dissociation (off rate, ▲) are plotted as a function of effective T-HmK concentration. Increasing the concentration of T-HmK from 1 to 17 nM increased the on rate of T-HmK from ~ 0.014 to 0.119 s−1, whereas the off rate was maintained at ~7.3 × 10⁻³ ± 1.1 × 10⁻³ s−1.
