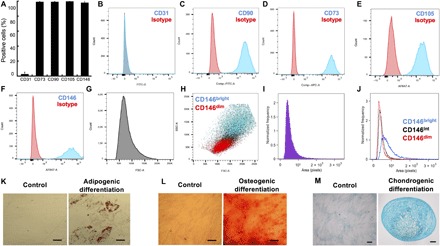
Fig. 1. Characterization of the hMSC population.

(A) Percentage of positive cells for CD31, CD73, CD90, CD105, and CD146 (n = 3). Representative histograms of the distribution of the CD31− (B), CD73− (C), CD90− (D), CD105− (E), and CD146− (F) level of expression are shown. (G) Representative histogram of the forward scatter (FSC) distribution. (H) Correlation between cell size [FSC and side scatter (SSC)] and the level of CD146 expression. (I) Representative histogram of the cell projected area distribution. (J) Representative histogram of the size distribution of the CD146dim, CD146int, and CD146bright (ImageSteam analysis). (K) Representative images of hMSCs differentiated toward adipogenic lineage (Oil Red O staining). (L) Representative images of UC-hMSCs differentiated toward osteogenic lineage in (Alizarin Red S staining). (M) Representative images of UC-hMSCs differentiated toward chondrogenic lineage (Alcian Blue staining in 2D and cryosectioned micromass cultures). Scale bars, 50 μm. The images were acquired using a binocular. FITC-A, fluorescein isothiocyanate–A; APC-A, allophycocyanin-A.
