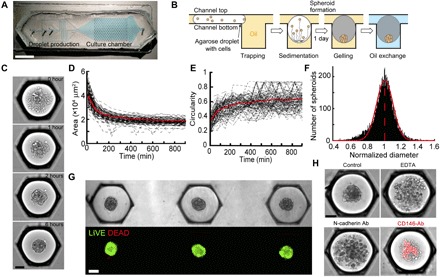
Fig. 2. Formation of MBs on chip.

(A) Chip design. Scale bar, 1 cm. (B) Schematized side view of an anchor through the MB formation and culture protocol. (C) Representative time lapse of an MB formation. Scale bar, 100 μm. (D and E) Measurement of the time evolution of the projected area (D) and circularity of each aggregate (E). n = 120 MBs. (F) Distribution of the MB diameter normalized by the mean of each chip (n = 10,072 MBs). (G) Top: Representative images of MBs after agarose gelation and oil-to-medium phase change. Bottom: The same MBs are stained with LIVE/DEAD. Scale bar, 100 μm. (H) Representative images of MBs formed in the presence of EDTA, an N-cadherin, or a CD146-conjugated blocking antibody (Ab) (the red color shows the position of the CD146 brightest cells, and the dilution of the antibody was 1/100 and remain in the droplet for the whole experiment). Scale bar, 100 μm. The images were acquired using a wide-field microscope.
