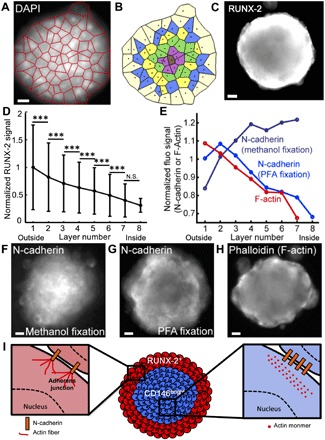
Fig. 4. Quantitative mapping of RUNX-2 expression and structural organization in MBs.

(A and B) The detection of nuclei within MBs enables the construction of a Voronoi diagram (A) that allows the identification of concentric cell layers (B) within the MBs. (C and D) Representative image (C) and quantitative analysis (D) (error bars represent the SD) of RUNX-2 staining within the cell layers of the MB (Nchips = 3 and nMBs = 458). N.S., nonsignificant. (E to H) Quantitative analysis (E) and representative images (F to H) of N-cadherin staining after methanol/acetone (F) (Nchips = 3 and nMBs = 405), after PFA/Triton X-100 fixation and permeabilization (G) (Nchips = 3 and nMBs = 649), and F-actin staining with phalloidin (H) (Nchips = 3 and nMBs = 421). Scale bars, 20 μm. The images were acquired using a wide-field microscope. ***P < 0.001. (I) Schematized representation of the structural organization of MBs.
