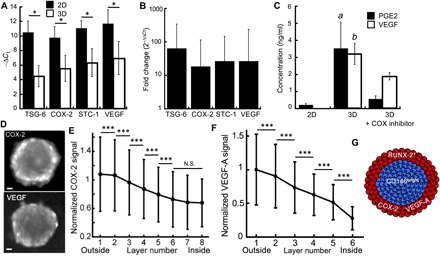
Fig. 5. Spatial patterning of the biological functions of hMSCs in 3D.

(A and B) RT-qPCR analysis of the relative TSG-6, COX-2, STC-1, and VEGF expression to GADPH (−ΔCt) (A) and relative RNA expression (B) in the 3D and 2D populations (n3D = 3 and n2D = 3). (C) Quantification by ELISA of the PGE-2 and VEGF secreted by hMSCs cultivated in 2D, as MBs or as MBs treated with indomethacin (nchips = 3 and n2D = 3). (D and E) Representative image (D) and quantitative analysis (E) of COX-2 (Nchips = 13 and nMBs = 2936) and (F) VEGF-A (Nchips = 3 and nMBs = 413) staining within the cell layers of the MBs (error bars represent the SD). Scale bars, 50 μm. The images were acquired using a wide-field microscope *P < 0.05; ***P < 0.001; a and b: P < 0.05. (G) Schematized representation of the structural organization of MBs.
