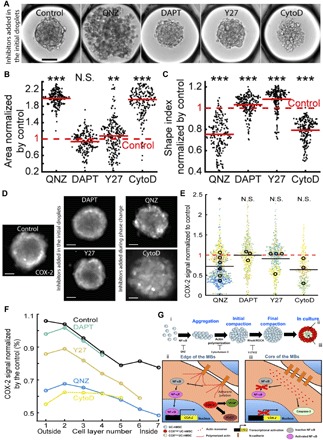
Fig. 6. Molecular mechanisms regulating the local level of COX-2 expression in MBS.

(A) Representative images of MBs formed 1 day after the droplet loading. Scale bar, 100 μm. Inhibitors are added to the culture medium before the MB formation. (B and C) Quantitative analysis of the aggregates projected area (B) and shape index (C) in the presence of the different inhibitors. Red lines represent the mean value for each condition. (D and E) Representative images (D) (contrast is adjusted individually for a better visualization of the pattern; scale bar, 100 μm; the images were acquired using a wide-field microscope) and quantitative analysis (E) of the COX-2 fluorescence signal intensity normalized by the control value with the different inhibitors. For these longer culturing times, QNZ and CytoD are only added during the phase change to allow the MB formation. Small dots represent one MB. Large dots represent the average normalized COX-2 fluorescence signal per chip. Each color corresponds to a specific chip. *P < 0.05. (F) Estimation of inhibitor effect in the cell layers with the COX-2 signal normalized by the control value. Control: Nchips = 11 and nMBs = 2,204; QNZ: Nchips = 6 and nMBs = 1215; DAPT: Nchips = 3 and nMBs = 658; Y27: Nchips = 4 and nMBs = 709; CytoD: Nchips = 3 and nMBs = 459. *P < 0.05; **P < 0.01; ***P < 0.001. (G) Proposed mechanisms regulating the MB formation and the patterning of their biological functions. (i) Regulation of the formation of MBs. (ii and iii) Spatial patterning of hMSC biological properties within MBs.
