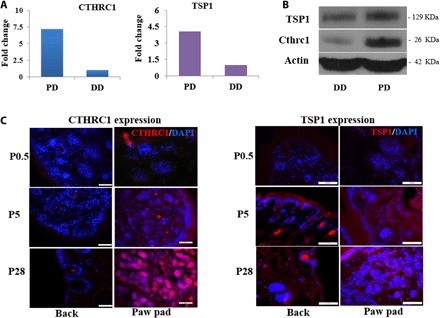
Fig. 3. Expression of CTHRC1 in different ECM.

(A and B) Differential expression of CTHRC1 and TSP1in PD and back dermis (DD) ECM of mice by proteomics analysis (A) and Western blotting (B). (C) CTHRC1 and TSP1 expression in back and plantar skin of mice at different developmental times. (Cthrc1/TSP1, red; DAPI, blue; scale bars, 50 μm).
