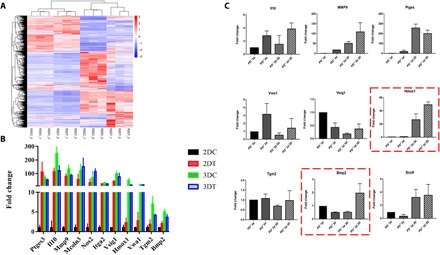
Fig. 4. The transcriptional analysis of four groups of cells revealed the specific gene response to 3D structure.

(A) Gene expression file of four groups of cells (R2DC, MSCs; R2DT, MSC with PD treatment; R3DC, MSC cultured in 3D construct; and R3DT, MSC treated with 3D/PD). (B) Up-regulated genes after treatment (2DC, MSCs; 2DT, MSC with PD treatment; 3DC, MSC cultured in 3D construct; and 3DT, MSC treated with 3D/PD). (C) Differentially expressed genes were further validated by RT-PCR analysis. [For all RT-PCR analyses, gene expression was normalized to glyceraldehyde-3-phosphate dehydrogenase (GAPDH) with 40 cycles, data are represented as the means ± SEM, and n = 3].
