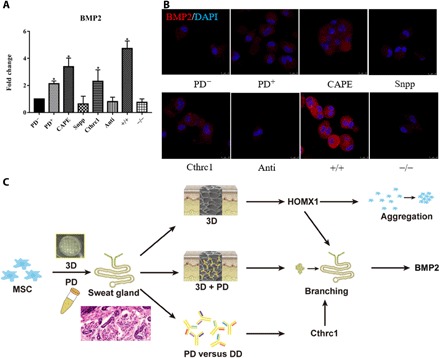
Fig. 5. CTHRC1 and HMOX1 synergistically boost SG fate of MSC.

(A and B) Transcriptional analysis (A) and translational analysis (PD−, MSCs; PD+, MSCs with 3D/PD treatment; CAPE, MSCs treated with 3D/PD and Hmox1 activator; Snpp, MSCs treated with 3D/PD and Hmox1 inhibitor; Cthrc1, MSCs treated with 3D/PD and recombinant CTHRC1; anti, MSCs treated with 3D/PD and CTHRC1 antibody: +/+, MSCs treated with 3D/PD and Hmox1 activator and recombinant CTHRC1; and −/−, MSCs treated with 3D/PD and Hmox1 inhibitor and CTHRC1 antibody. Data are represented as the means ± SEM and n = 3) (B) of bmp2 with regulation of CTHRC1 and Hmox1. (C) The graphic illustration of 3D-bioprinted matrix directed MSC differentiation. CTHRC1 is the main biochemical cues during SG development, and structural cues up-regulated the expression of Hmox1 synergistically initiated branching morphogenesis of SG. *P < 0.05.
