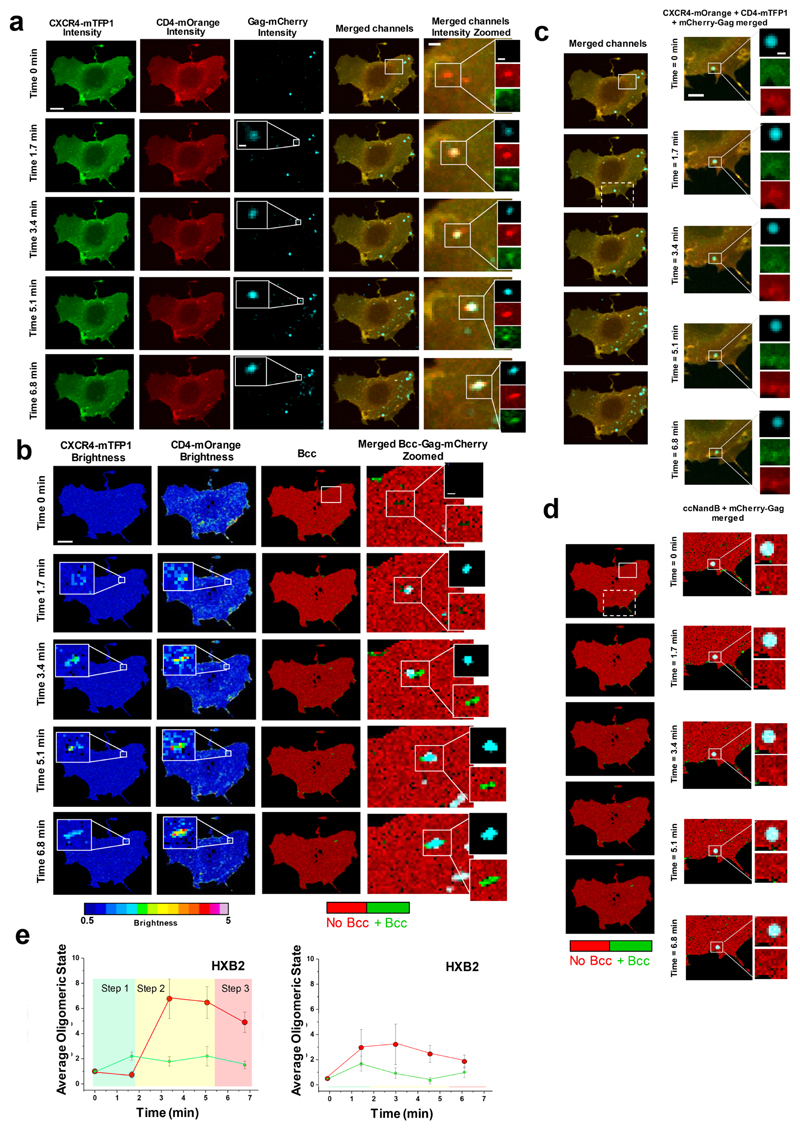
Figure 2. Visualization of HXB2 based HIV-1 virion receptor stoichiometry in live cells.
a, Fast time-resolved, three-color imaging was performed on a COS7 cell co-expressing CXCR4-mTFP1 (green micrographs) and CD4-mOrange (red micrographs) exposed to HIVHXB2 –Gag-iCherry virions (cyan micrographs), scale bar 1 μm. b, Time-resolved brightness analysis was performed for both CXCR4-mTFP1 (first column from the left) and CD4-mOrange (second column from the left). Time-resolved cross-variance (Bcc) analysis was also performed (third column from the left) rendering a small region of interest in which CD4-CXCR4 interactions occurred (green). Real-time single virus tracking was performed in parallel and the micrographs show co-localization of HIVHXB2 –Gag-iCherry (cyan pixels) and positive Bcc (green pixels). c, A second region of interest (dashed square) shows a HIVHXB2-Gag-iCherry virus that did not induce positive Bcc (d). These viruses most likely were immature and constitute robust built-in controls for our N&B and Bcc analysis. e, Time-resolved stoichiometry for CD4 (red dots) and CXCR4 (green dots) upon addition of HIVHXB2/GagiCherry (left panel). The circles indicate the average (n = 10) and the error bars indicate the standard error for each time point. The time-resolved homotypic interactions for CD4 (red dots) and CXCR4 (green dots) upon addition of HIVHXB2/GagiCherry in the presence of inhibitory concentrations of b12. CD4 and CXCR4 did not interact in this case. Eror bars indicate standard error for each time point wich is the average for n = 12.

