
Fig. 1.
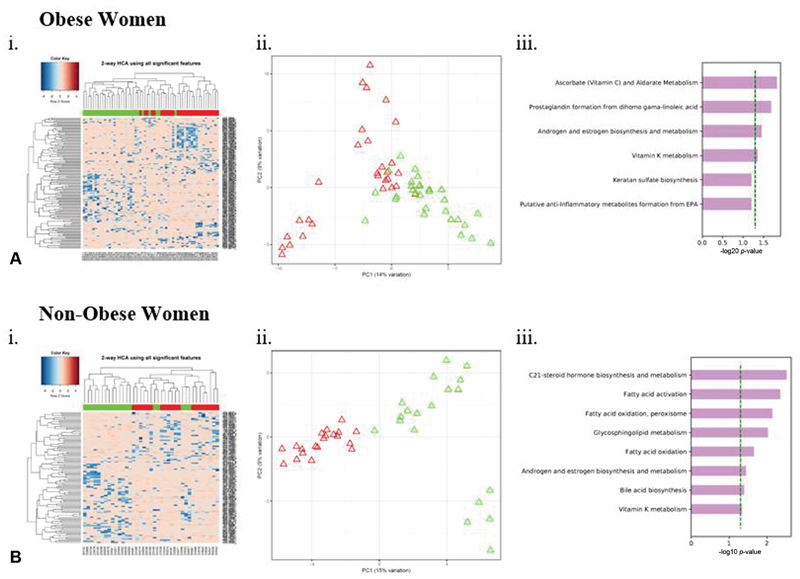
Two-way hierarchical cluster analysis (HCA) (i), principal components analysis (PCA) (ii), and metabolic pathway analysis (iii) showing metabolites and metabolic pathways differentially expressed between women with labor dystocia and normal labor controls among (A) obese and (B) nonobese women caption: Each column in HCA represents a participant and each row represents a metabolite feature. Red hues indicate metabolites with enhanced levels, and blue hues represent metabolites with lower metabolite concentrations. Labor dystocia is represented in green and normal labor in red across x-axis. Red triangles in PCA represent normal labor and green triangles represent labor dystocia. ( A ) Obese women, (i) HCA with top 140/8813 metabolites with a raw p < 0.05 is shown and (ii) PCA and (iii) Mummichog enriched metabolic pathways differentiating labor dystocia in matched groups ( B ) Nonobese women, (i) HCA with top 109/8704 metabolites with a raw p < 0.05 is shown and (ii) PCA and (iii) Mummichog enriched metabolic pathways differentiating labor dystocia in matched groups of ( A ) obese and ( B ) nonobese women shown with dotted green line represents pathways significant at p < 0.05. Metabolic pathway analyses include adjustment within each group for maternal body mass index (continuous, at hospital admission for labor) and maternal age.