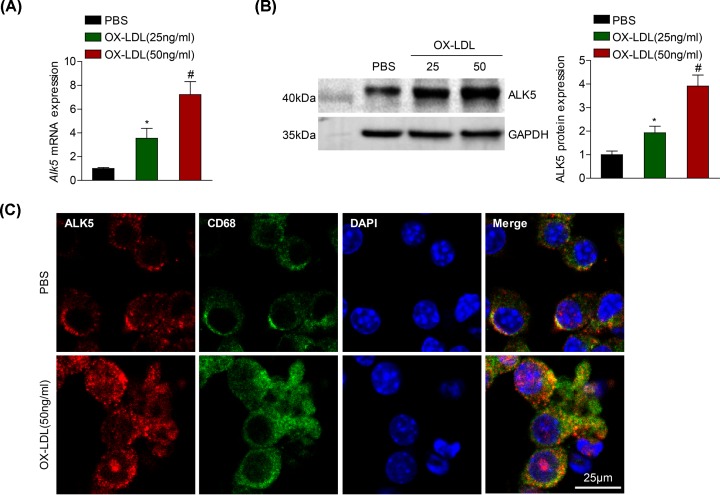
Figure 1. Increased ALK5 expression in macrophage induced by OX-LDL.
(A and B) RT-PCR analysis or Western blot analysis of ALK5 mRNA (A) or protein (B) expression in BMDMs after 24 h of stimulation with OX-LDL at the indicated concentration (25 and 50 ng/ml); n = 3. (C) Co-staining of ALK5 expression in macrophage with ALK5 (red) and CD68 (green) induced by OX-LDL (50 ng/ml); n = 3; scale bar = 25 μm. *P < 0.05 compared with PBS treated group. #P < 0.05 compared with OX-LDL (25 ng/ml) treated group.

