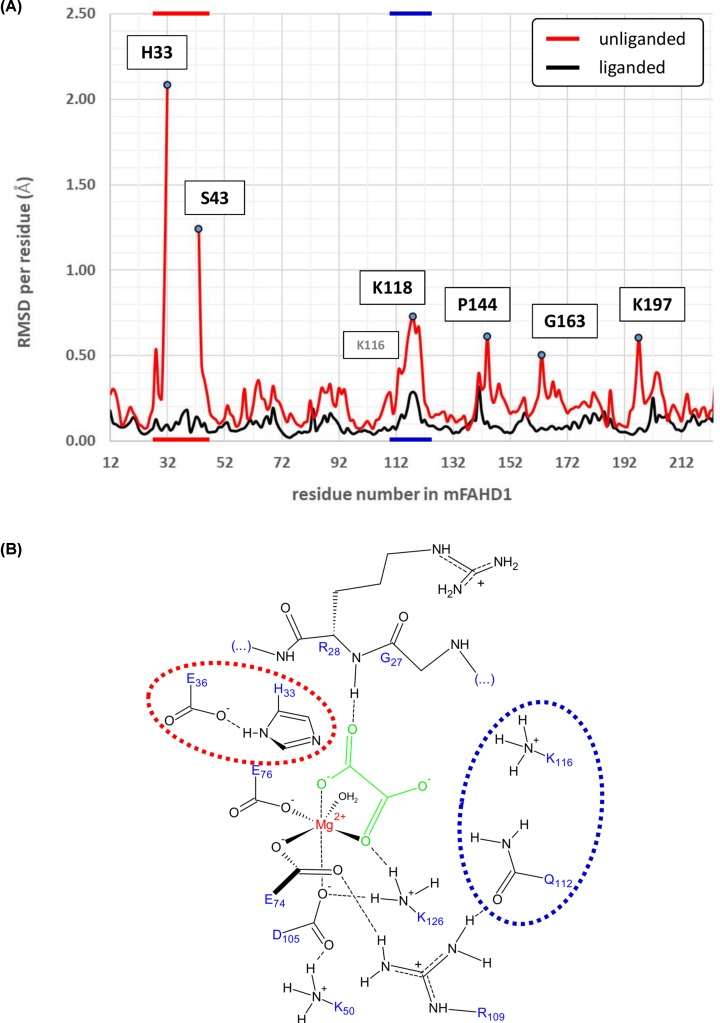
Figure 1. Structural comparison of native and complexed mFAHD1.
(A) Root-mean-square-deviation (RMSD) between each of the proteins in the ASU in the native (6SBJ, red) and complexed (6SBI, black) structure. The average RMSD is below 0.25Å, except for five regions, denoted by their major peaks in the RMSD per residue plot. The major two regions are marked by color (red and blue), that map to (B) of this figure. The red region indicates the flexible ‘lid’ region of FAHD1, that rigidifies upon ligand binding. Amino acid residues 33–42 are missing in 6SBJ due to disorder and excluded from the plot. (B) Sketch of the mFAHD1active site (6SBI), in analogy to hFAHD1 (6FOG) [6]. The two regions around residues H33 to E36 (denoted in red), and around Q112 to K118 (denoted in blue) become ordered upon ligand binding. Compared with data presented in (A) with the same coloring.

