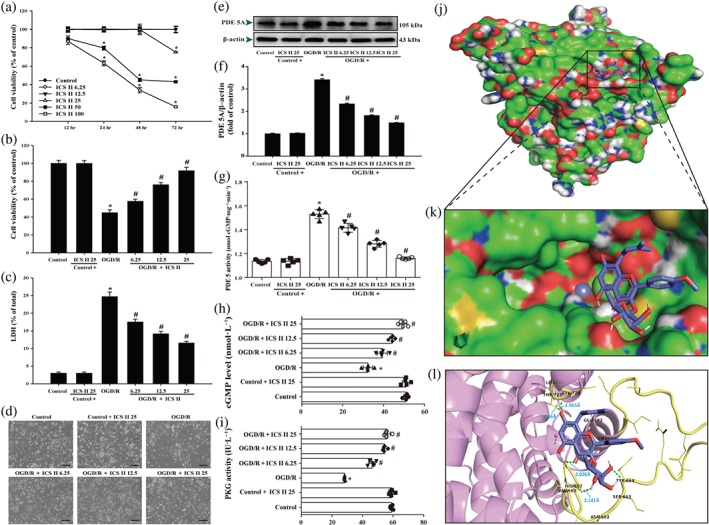
Figure 4.

Icariside II (ICS II) attenuates oxygen–glucose deprivation and reoxygenation (OGD/R)‐induced cytotoxicity and inhibited PDE 5. (a) Primary cortical neurons were treated with different concentrations of icariside II and cell viability was determined by MTT (n = 5). Neuronal cells were treated with or without icariside II for 24 hr after OGD/R. (b) Cell viability was measured using the MTT assay (n = 5). (c) Cytotoxicity was detected using the intracellular lactate dehydrogenase (LDH) release assay (n = 5). (d) The morphology of neuronal cells was observed using reverse‐phase microscope. (e) PDE 5A expression. (f) Quantitation of PDE 5A (n = 5). (g) PDE 5 activity. (h) cGMP level (n = 5). (i) PKG activity (n = 5). The docking results of icariside II with the PDE 5 complex. (j) The whole view of the icariside II dimer and PDE 5 displaying the molecular binding pocket. (k) A close‐up amplification of the molecule binding pocket from the side. (l) Crystal structure of icariside II (blue) displaying PDE 5 (yellow and pink) bound to the docking pocket. Hydrogen bonds were shown as green dotted lines. Data were expressed as mean ± SEM of five independent experiments. *P < .05 versus control group; # P < .05 versus OGD/R group
