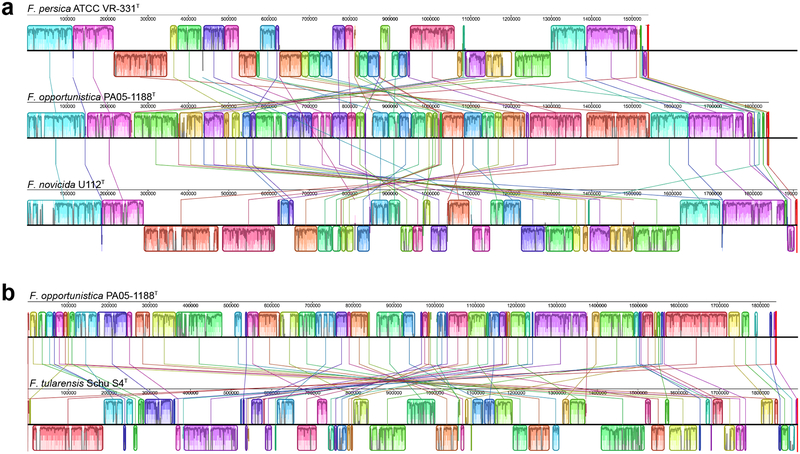
Fig. 2.
Genome structure comparisons showing extensive rearrangement. (A) F. persica, F. opportunistica, and F. novicida. (B) F. opportunistica and F. tularensis (shown separately to highlight more extensive rearrangement). Locally collinear blocks are color coded, and local average nucleotide conservation is shown in graphs within the blocks. Homologous blocks are connected by colored lines. Blocks above the black line are in forward orientation compared to F. opportunistica, and those below the line are in reverse orientation. Figure was generated using progressiveMauve and Geneious 11.0.4 [14, 15, 19].

